|
Download Data (XLS File) |
|
||||||||
|
||||||||
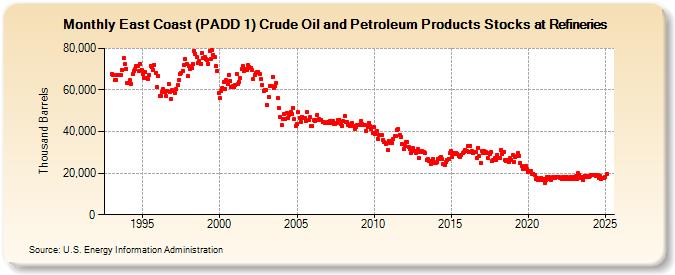
| East Coast (PADD 1) Crude Oil and Petroleum Products Stocks at Refineries (Thousand Barrels) | ||||||||
| Year | Jan | Feb | Mar | Apr | May | Jun | Jul | Aug | Sep | Oct | Nov | Dec |
|---|---|---|---|---|---|---|---|---|---|---|---|---|
| 1993 | 67,761 | 67,309 | 64,688 | 64,662 | 67,206 | 67,311 | 67,154 | 67,333 | 69,634 | 75,282 | 72,385 | 70,212 |
| 1994 | 63,205 | 63,437 | 64,620 | 63,092 | 67,442 | 69,180 | 69,937 | 71,377 | 71,489 | 69,139 | 72,711 | 69,806 |
| 1995 | 67,841 | 65,627 | 68,753 | 65,784 | 65,128 | 67,182 | 71,531 | 70,959 | 69,715 | 72,144 | 68,121 | 61,282 |
| 1996 | 66,859 | 57,116 | 57,302 | 59,126 | 60,295 | 59,252 | 57,329 | 59,571 | 62,969 | 59,221 | 55,688 | 59,923 |
| 1997 | 59,490 | 58,750 | 60,449 | 62,430 | 64,788 | 67,527 | 68,403 | 69,327 | 72,113 | 74,668 | 72,551 | 66,718 |
| 1998 | 71,476 | 69,951 | 70,531 | 72,684 | 78,768 | 77,473 | 75,674 | 73,109 | 74,143 | 72,697 | 78,020 | 75,241 |
| 1999 | 75,910 | 74,859 | 74,579 | 72,646 | 78,814 | 75,126 | 79,012 | 76,863 | 75,649 | 71,678 | 69,211 | 58,715 |
| 2000 | 56,100 | 59,606 | 61,143 | 64,036 | 60,693 | 64,650 | 62,880 | 67,225 | 64,204 | 61,426 | 61,961 | 61,421 |
| 2001 | 62,483 | 67,911 | 62,741 | 63,745 | 65,701 | 69,933 | 71,515 | 69,046 | 70,025 | 69,705 | 71,788 | 71,164 |
| 2002 | 70,660 | 69,644 | 65,187 | 67,258 | 68,237 | 68,681 | 68,872 | 67,448 | 65,242 | 62,436 | 59,614 | 60,091 |
| 2003 | 59,960 | 52,682 | 56,709 | 61,781 | 61,939 | 66,441 | 61,153 | 61,750 | 63,548 | 55,996 | 51,159 | 46,767 |
| 2004 | 43,133 | 46,243 | 48,417 | 45,996 | 48,980 | 46,556 | 48,031 | 49,298 | 48,382 | 51,201 | 45,913 | 42,613 |
| 2005 | 43,591 | 49,227 | 46,707 | 44,630 | 47,169 | 46,301 | 46,748 | 45,196 | 49,318 | 45,612 | 46,828 | 42,717 |
| 2006 | 42,765 | 45,535 | 45,065 | 45,500 | 48,020 | 46,113 | 45,432 | 45,676 | 44,381 | 44,627 | 43,966 | 44,283 |
| 2007 | 44,742 | 44,090 | 45,199 | 44,040 | 45,255 | 43,622 | 43,763 | 44,311 | 45,755 | 45,682 | 43,720 | 42,889 |
| 2008 | 44,962 | 47,362 | 44,759 | 44,363 | 43,340 | 42,794 | 43,511 | 43,982 | 42,585 | 41,424 | 42,395 | 42,986 |
| 2009 | 42,997 | 42,963 | 45,111 | 43,679 | 43,124 | 43,116 | 40,168 | 42,184 | 44,242 | 42,638 | 41,038 | 39,447 |
| 2010 | 42,070 | 38,959 | 40,142 | 36,632 | 38,140 | 38,525 | 38,391 | 36,154 | 34,803 | 33,825 | 34,545 | 31,058 |
| 2011 | 35,606 | 34,525 | 34,420 | 36,503 | 37,711 | 37,907 | 40,805 | 41,257 | 38,551 | 37,350 | 33,886 | 31,590 |
| 2012 | 32,966 | 35,006 | 35,203 | 32,792 | 31,458 | 29,709 | 31,916 | 30,556 | 30,669 | 29,849 | 31,431 | 27,226 |
| 2013 | 30,384 | 30,658 | 30,080 | 30,230 | 29,526 | 26,488 | 26,692 | 25,825 | 24,519 | 25,761 | 26,826 | 25,054 |
| 2014 | 24,971 | 25,500 | 26,947 | 27,352 | 27,893 | 26,592 | 24,494 | 23,866 | 25,353 | 26,343 | 27,019 | 29,578 |
| 2015 | 30,485 | 27,845 | 29,607 | 29,012 | 29,834 | 29,260 | 28,153 | 27,906 | 28,889 | 29,476 | 30,379 | 31,218 |
| 2016 | 30,793 | 32,833 | 30,244 | 33,219 | 30,847 | 29,497 | 30,078 | 30,327 | 27,382 | 32,298 | 28,340 | 24,826 |
| 2017 | 30,614 | 29,552 | 30,731 | 29,936 | 29,731 | 27,454 | 29,359 | 30,131 | 25,948 | 26,546 | 27,348 | 26,500 |
| 2018 | 28,915 | 27,254 | 27,040 | 31,356 | 29,378 | 30,272 | 26,181 | 25,703 | 26,236 | 25,144 | 27,249 | 26,456 |
| 2019 | 28,492 | 25,295 | 27,766 | 28,025 | 29,688 | 28,292 | 24,920 | 23,640 | 21,910 | 23,000 | 23,252 | 21,969 |
| 2020 | 20,479 | 20,986 | 20,986 | 19,758 | 19,770 | 19,071 | 17,288 | 17,649 | 16,508 | 16,887 | 17,858 | 16,861 |
| 2021 | 17,375 | 15,486 | 16,862 | 17,902 | 17,979 | 17,146 | 16,720 | 17,977 | 17,706 | 17,837 | 18,252 | 17,937 |
| 2022 | 17,951 | 17,795 | 17,320 | 18,242 | 16,980 | 18,072 | 17,931 | 16,995 | 17,072 | 18,172 | 17,294 | 17,385 |
| 2023 | 18,060 | 18,427 | 17,315 | 19,939 | 19,178 | 17,779 | 18,292 | 16,689 | 18,793 | 18,025 | 18,723 | 18,065 |
| 2024 | 18,445 | 18,905 | 19,259 | 19,301 | ||||||||
| - = No Data Reported; -- = Not Applicable; NA = Not Available; W = Withheld to avoid disclosure of individual company data. |
| Release Date: 6/28/2024 |
| Next Release Date: 7/31/2024 |