|
Download Data (XLS File) |
|
||||||||
|
||||||||
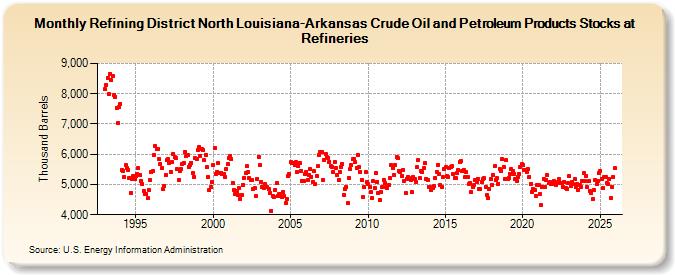
| Refining District North Louisiana-Arkansas Crude Oil and Petroleum Products Stocks at Refineries (Thousand Barrels) | ||||||||
| Year | Jan | Feb | Mar | Apr | May | Jun | Jul | Aug | Sep | Oct | Nov | Dec |
|---|---|---|---|---|---|---|---|---|---|---|---|---|
| 1993 | 8,143 | 8,292 | 8,514 | 7,982 | 8,668 | 8,441 | 8,583 | 7,952 | 7,908 | 7,534 | 7,017 | 7,567 |
| 1994 | 7,661 | 5,479 | 5,461 | 5,257 | 5,635 | 5,537 | 5,473 | 5,226 | 4,729 | 5,179 | 5,275 | 5,174 |
| 1995 | 5,288 | 5,347 | 5,534 | 5,316 | 5,130 | 5,014 | 4,794 | 4,691 | 4,688 | 4,539 | 4,830 | 5,147 |
| 1996 | 5,406 | 5,430 | 5,977 | 6,269 | 6,175 | 6,184 | 5,841 | 5,681 | 5,537 | 4,841 | 4,964 | 5,312 |
| 1997 | 5,812 | 5,828 | 5,712 | 5,422 | 5,741 | 6,022 | 5,896 | 5,876 | 5,503 | 5,132 | 5,445 | 5,505 |
| 1998 | 5,690 | 5,725 | 6,088 | 5,931 | 5,960 | 5,583 | 5,642 | 5,720 | 5,368 | 5,253 | 5,864 | 5,840 |
| 1999 | 6,127 | 6,236 | 5,957 | 6,183 | 6,127 | 5,794 | 5,988 | 5,565 | 5,235 | 4,808 | 4,918 | 5,088 |
| 2000 | 5,659 | 6,204 | 5,356 | 5,422 | 5,708 | 5,391 | 5,381 | 5,333 | 5,358 | 5,248 | 5,512 | 5,669 |
| 2001 | 5,865 | 5,945 | 5,836 | 5,060 | 4,818 | 4,693 | 4,783 | 4,637 | 4,875 | 4,521 | 4,656 | 4,995 |
| 2002 | 5,225 | 5,377 | 5,596 | 5,410 | 5,200 | 5,156 | 5,140 | 4,843 | 4,867 | 4,608 | 5,196 | 5,917 |
| 2003 | 5,638 | 5,090 | 4,928 | 4,886 | 4,999 | 4,925 | 4,916 | 4,835 | 4,726 | 4,126 | 4,604 | 4,581 |
| 2004 | 4,833 | 5,049 | 4,611 | 4,680 | 4,687 | 4,588 | 4,735 | 4,606 | 4,371 | 4,524 | 5,269 | 5,330 |
| 2005 | 5,743 | 5,699 | 5,706 | 5,651 | 5,746 | 5,414 | 5,610 | 5,695 | 5,461 | 5,127 | 5,106 | 5,331 |
| 2006 | 5,408 | 5,160 | 5,325 | 5,503 | 5,256 | 5,096 | 5,436 | 5,002 | 5,293 | 5,598 | 5,967 | 6,062 |
| 2007 | 6,086 | 5,152 | 5,813 | 6,010 | 5,912 | 5,891 | 5,754 | 5,600 | 5,589 | 5,407 | 5,736 | 5,551 |
| 2008 | 5,326 | 5,160 | 5,426 | 5,592 | 5,680 | 4,654 | 4,855 | 4,916 | 4,385 | 5,209 | 5,496 | 5,636 |
| 2009 | 5,832 | 5,841 | 5,728 | 5,555 | 5,985 | 5,581 | 5,428 | 5,147 | 4,575 | 4,906 | 5,419 | 5,071 |
| 2010 | 5,004 | 4,906 | 4,761 | 4,558 | 5,104 | 4,899 | 5,378 | 5,097 | 4,733 | 4,476 | 4,748 | 4,930 |
| 2011 | 5,158 | 5,044 | 4,900 | 4,879 | 4,988 | 5,211 | 5,629 | 5,554 | 5,325 | 5,651 | 5,904 | 5,859 |
| 2012 | 5,452 | 5,400 | 5,283 | 5,487 | 5,128 | 4,722 | 5,196 | 5,257 | 5,199 | 5,162 | 4,742 | 5,252 |
| 2013 | 5,184 | 5,091 | 5,568 | 5,805 | 5,202 | 5,444 | 5,414 | 5,535 | 5,707 | 5,190 | 5,157 | 4,909 |
| 2014 | 4,902 | 4,813 | 4,893 | 4,935 | 5,227 | 5,423 | 5,647 | 5,351 | 4,990 | 4,930 | 5,237 | 5,496 |
| 2015 | 5,561 | 5,265 | 5,243 | 5,543 | 5,574 | 5,600 | 5,362 | 5,221 | 5,209 | 5,372 | 5,494 | 5,733 |
| 2016 | 5,763 | 5,445 | 5,491 | 5,231 | 5,399 | 5,246 | 5,012 | 5,044 | 4,747 | 4,931 | 4,970 | 5,153 |
| 2017 | 5,095 | 5,189 | 4,864 | 4,840 | 5,088 | 5,167 | 5,201 | 4,922 | 4,658 | 4,565 | 4,848 | 5,166 |
| 2018 | 4,997 | 5,307 | 5,602 | 5,139 | 5,203 | 5,026 | 5,504 | 5,448 | 5,832 | 5,591 | 5,185 | 5,808 |
| 2019 | 5,194 | 5,218 | 5,359 | 5,508 | 5,449 | 5,349 | 5,173 | 5,129 | 5,248 | 5,361 | 5,592 | 5,667 |
| 2020 | 5,648 | 5,467 | 5,472 | 5,420 | 5,512 | 5,255 | 5,011 | 4,754 | 4,862 | 4,819 | 4,624 | 4,968 |
| 2021 | 4,967 | 4,683 | 4,315 | 4,903 | 5,191 | 4,911 | 5,158 | 5,299 | 5,049 | 5,075 | 4,999 | 5,034 |
| 2022 | 5,108 | 5,027 | 4,983 | 5,074 | 5,184 | 5,052 | 5,053 | 4,921 | 5,096 | 4,895 | 4,851 | 5,037 |
| 2023 | 5,265 | 4,950 | 5,077 | 5,002 | 5,175 | 4,906 | 5,003 | 4,819 | 4,946 | 4,868 | 5,132 | 5,318 |
| 2024 | 5,108 | 5,295 | 4,914 | 5,100 | ||||||||
| - = No Data Reported; -- = Not Applicable; NA = Not Available; W = Withheld to avoid disclosure of individual company data. |
| Release Date: 6/28/2024 |
| Next Release Date: 7/31/2024 |