|
Download Data (XLS File) |
|
||||||||
|
||||||||
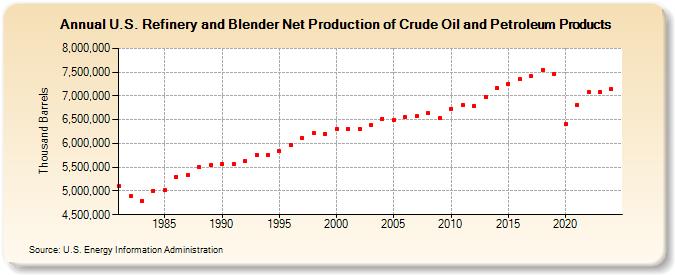
| U.S. Refinery and Blender Net Production of Crude Oil and Petroleum Products (Thousand Barrels) | ||||||||
| Decade | Year-0 | Year-1 | Year-2 | Year-3 | Year-4 | Year-5 | Year-6 | Year-7 | Year-8 | Year-9 |
|---|---|---|---|---|---|---|---|---|---|---|
| 1980's | 5,106,374 | 4,887,757 | 4,795,353 | 5,006,527 | 5,018,612 | 5,300,676 | 5,338,657 | 5,498,146 | 5,538,702 | |
| 1990's | 5,574,458 | 5,568,548 | 5,635,507 | 5,762,251 | 5,763,584 | 5,837,945 | 5,974,675 | 6,116,870 | 6,216,008 | 6,201,141 |
| 2000's | 6,310,904 | 6,309,000 | 6,304,620 | 6,382,794 | 6,519,753 | 6,497,015 | 6,560,912 | 6,567,929 | 6,641,293 | 6,527,069 |
| 2010's | 6,735,067 | 6,815,590 | 6,794,407 | 6,973,710 | 7,173,730 | 7,258,314 | 7,348,911 | 7,408,771 | 7,552,902 | 7,460,380 |
| 2020's | 6,400,888 | 6,811,660 | 7,079,773 | 7,095,169 |
| - = No Data Reported; -- = Not Applicable; NA = Not Available; W = Withheld to avoid disclosure of individual company data. |
| Release Date: 3/29/2024 |
| Next Release Date: 8/30/2024 |