|
Download Data (XLS File) |
|
||||||||
|
||||||||
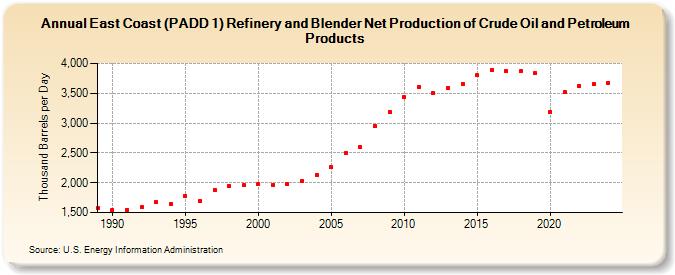
| East Coast (PADD 1) Refinery and Blender Net Production of Crude Oil and Petroleum Products (Thousand Barrels per Day) | ||||||||
| Decade | Year-0 | Year-1 | Year-2 | Year-3 | Year-4 | Year-5 | Year-6 | Year-7 | Year-8 | Year-9 |
|---|---|---|---|---|---|---|---|---|---|---|
| 1980's | 1,576 | |||||||||
| 1990's | 1,546 | 1,549 | 1,588 | 1,671 | 1,650 | 1,786 | 1,700 | 1,885 | 1,943 | 1,960 |
| 2000's | 1,972 | 1,968 | 1,978 | 2,034 | 2,137 | 2,260 | 2,502 | 2,592 | 2,953 | 3,193 |
| 2010's | 3,435 | 3,610 | 3,498 | 3,589 | 3,659 | 3,799 | 3,894 | 3,871 | 3,869 | 3,838 |
| 2020's | 3,189 | 3,520 | 3,628 | 3,648 |
| - = No Data Reported; -- = Not Applicable; NA = Not Available; W = Withheld to avoid disclosure of individual company data. |
| Release Date: 3/29/2024 |
| Next Release Date: 8/30/2024 |