|
Download Data (XLS File) |
|
||||||||
|
||||||||
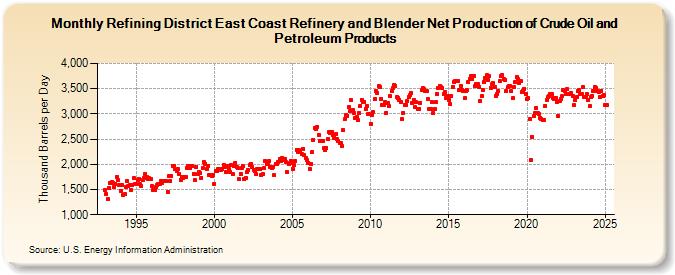
| Refining District East Coast Refinery and Blender Net Production of Crude Oil and Petroleum Products (Thousand Barrels per Day) | ||||||||
| Year | Jan | Feb | Mar | Apr | May | Jun | Jul | Aug | Sep | Oct | Nov | Dec |
|---|---|---|---|---|---|---|---|---|---|---|---|---|
| 1993 | 1,499 | 1,407 | 1,307 | 1,536 | 1,630 | 1,651 | 1,635 | 1,546 | 1,615 | 1,757 | 1,692 | 1,586 |
| 1994 | 1,478 | 1,588 | 1,395 | 1,404 | 1,555 | 1,663 | 1,562 | 1,582 | 1,491 | 1,593 | 1,726 | 1,605 |
| 1995 | 1,600 | 1,693 | 1,709 | 1,603 | 1,569 | 1,685 | 1,725 | 1,811 | 1,744 | 1,712 | 1,721 | 1,699 |
| 1996 | 1,562 | 1,490 | 1,490 | 1,544 | 1,593 | 1,608 | 1,613 | 1,664 | 1,635 | 1,669 | 1,661 | 1,666 |
| 1997 | 1,452 | 1,760 | 1,671 | 1,765 | 1,974 | 1,969 | 1,897 | 1,865 | 1,911 | 1,809 | 1,698 | 1,752 |
| 1998 | 1,726 | 1,739 | 1,748 | 1,930 | 1,968 | 1,921 | 1,965 | 1,969 | 1,816 | 1,698 | 1,947 | 1,805 |
| 1999 | 1,851 | 1,819 | 1,736 | 1,925 | 2,049 | 2,011 | 1,911 | 1,976 | 1,787 | 1,792 | 1,775 | 1,783 |
| 2000 | 1,611 | 1,864 | 1,874 | 1,910 | 1,897 | 1,887 | 1,914 | 1,996 | 1,943 | 1,844 | 1,961 | 1,900 |
| 2001 | 1,852 | 1,985 | 1,798 | 1,965 | 2,028 | 1,938 | 1,919 | 1,699 | 1,812 | 1,927 | 1,964 | 1,703 |
| 2002 | 1,738 | 1,839 | 1,884 | 1,988 | 2,011 | 1,942 | 1,893 | 1,868 | 1,807 | 1,909 | 1,900 | 1,910 |
| 2003 | 1,793 | 1,798 | 1,928 | 2,056 | 2,006 | 2,023 | 2,070 | 1,944 | 1,927 | 1,937 | 1,782 | 2,014 |
| 2004 | 2,000 | 2,047 | 2,098 | 2,061 | 2,133 | 2,090 | 2,105 | 2,043 | 1,843 | 1,998 | 2,027 | 2,071 |
| 2005 | 1,914 | 1,991 | 2,061 | 2,287 | 2,251 | 2,274 | 2,242 | 2,213 | 2,310 | 2,184 | 2,134 | 2,085 |
| 2006 | 2,031 | 1,915 | 2,012 | 2,235 | 2,488 | 2,723 | 2,700 | 2,745 | 2,589 | 2,467 | 2,457 | 2,469 |
| 2007 | 2,316 | 2,276 | 2,327 | 2,498 | 2,650 | 2,622 | 2,641 | 2,585 | 2,530 | 2,594 | 2,497 | 2,459 |
| 2008 | 2,429 | 2,415 | 2,357 | 2,678 | 2,893 | 2,969 | 2,959 | 3,134 | 3,065 | 3,266 | 3,077 | 3,018 |
| 2009 | 2,924 | 2,933 | 2,881 | 3,027 | 3,164 | 3,285 | 3,243 | 3,240 | 3,104 | 3,160 | 2,993 | 2,995 |
| 2010 | 2,807 | 2,982 | 3,035 | 3,291 | 3,450 | 3,422 | 3,554 | 3,542 | 3,304 | 3,181 | 3,179 | 3,229 |
| 2011 | 3,026 | 3,209 | 3,149 | 3,350 | 3,458 | 3,512 | 3,580 | 3,555 | 3,333 | 3,325 | 3,285 | 3,242 |
| 2012 | 2,893 | 3,027 | 3,184 | 3,183 | 3,253 | 3,335 | 3,374 | 3,421 | 3,216 | 3,284 | 3,128 | 3,226 |
| 2013 | 3,105 | 3,103 | 3,223 | 3,477 | 3,511 | 3,486 | 3,446 | 3,448 | 3,287 | 3,097 | 3,099 | 3,238 |
| 2014 | 3,017 | 3,103 | 3,226 | 3,399 | 3,523 | 3,562 | 3,525 | 3,509 | 3,391 | 3,436 | 3,307 | 3,356 |
| 2015 | 3,279 | 3,188 | 3,353 | 3,542 | 3,630 | 3,643 | 3,643 | 3,656 | 3,470 | 3,559 | 3,478 | 3,445 |
| 2016 | 3,309 | 3,447 | 3,466 | 3,625 | 3,700 | 3,761 | 3,692 | 3,750 | 3,551 | 3,601 | 3,594 | 3,541 |
| 2017 | 3,254 | 3,348 | 3,474 | 3,630 | 3,717 | 3,762 | 3,668 | 3,744 | 3,514 | 3,590 | 3,612 | 3,534 |
| 2018 | 3,351 | 3,394 | 3,460 | 3,646 | 3,749 | 3,781 | 3,684 | 3,681 | 3,462 | 3,528 | 3,559 | 3,554 |
| 2019 | 3,449 | 3,306 | 3,532 | 3,624 | 3,731 | 3,690 | 3,617 | 3,656 | 3,436 | 3,452 | 3,495 | 3,387 |
| 2020 | 3,304 | 3,320 | 2,895 | 2,084 | 2,551 | 2,955 | 3,009 | 3,113 | 3,015 | 2,997 | 2,926 | 2,905 |
| 2021 | 2,878 | 2,880 | 3,154 | 3,281 | 3,334 | 3,358 | 3,387 | 3,391 | 3,316 | 3,298 | 3,322 | 3,236 |
| 2022 | 2,959 | 3,263 | 3,303 | 3,354 | 3,473 | 3,456 | 3,397 | 3,485 | 3,393 | 3,396 | 3,406 | 3,360 |
| 2023 | 3,174 | 3,268 | 3,328 | 3,450 | 3,470 | 3,389 | 3,394 | 3,531 | 3,329 | 3,328 | 3,387 | 3,282 |
| 2024 | 3,155 | 3,326 | 3,364 | 3,456 | 3,536 | 3,509 | 3,461 | 3,430 | 3,334 | 3,456 | 3,351 | 3,365 |
| 2025 | 3,177 | 3,181 | 3,217 | 3,420 | ||||||||
| - = No Data Reported; -- = Not Applicable; NA = Not Available; W = Withheld to avoid disclosure of individual company data. |
| Release Date: 6/30/2025 |
| Next Release Date: 7/31/2025 |