|
Download Data (XLS File) |
|
||||||||
|
||||||||
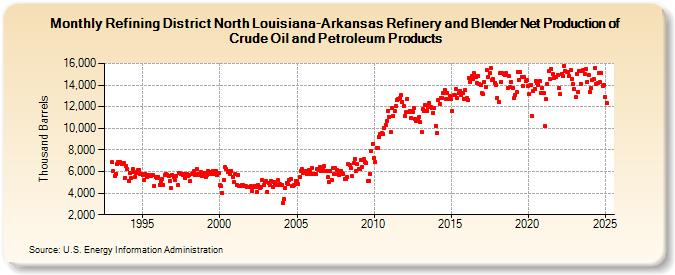
| Refining District North Louisiana-Arkansas Refinery and Blender Net Production of Crude Oil and Petroleum Products (Thousand Barrels) | ||||||||
| Year | Jan | Feb | Mar | Apr | May | Jun | Jul | Aug | Sep | Oct | Nov | Dec |
|---|---|---|---|---|---|---|---|---|---|---|---|---|
| 1993 | 6,850 | 6,016 | 5,575 | 5,793 | 6,662 | 6,912 | 6,912 | 6,743 | 6,740 | 6,813 | 5,443 | 6,545 |
| 1994 | 6,221 | 5,138 | 5,883 | 5,364 | 6,186 | 5,972 | 5,492 | 5,818 | 6,096 | 6,150 | 5,744 | 5,783 |
| 1995 | 5,705 | 5,188 | 5,810 | 5,513 | 5,705 | 5,591 | 5,574 | 5,643 | 5,656 | 4,697 | 5,455 | 5,392 |
| 1996 | 5,510 | 4,788 | 5,128 | 5,336 | 4,760 | 5,722 | 5,785 | 5,707 | 5,544 | 5,135 | 4,452 | 5,708 |
| 1997 | 5,499 | 5,172 | 5,611 | 4,721 | 5,872 | 5,820 | 5,788 | 5,652 | 5,756 | 5,432 | 5,768 | 5,593 |
| 1998 | 5,637 | 5,078 | 5,744 | 5,848 | 6,007 | 5,639 | 6,210 | 5,800 | 5,692 | 5,965 | 5,570 | 5,901 |
| 1999 | 5,903 | 5,526 | 5,682 | 6,065 | 5,978 | 5,734 | 5,910 | 6,036 | 5,740 | 6,008 | 5,691 | 5,891 |
| 2000 | 4,744 | 4,619 | 4,002 | 5,240 | 6,384 | 6,203 | 5,976 | 6,016 | 5,762 | 6,051 | 5,503 | 5,017 |
| 2001 | 5,785 | 4,726 | 5,659 | 4,638 | 4,628 | 4,771 | 4,743 | 4,636 | 4,614 | 4,580 | 4,566 | 4,527 |
| 2002 | 4,666 | 4,200 | 4,566 | 4,660 | 4,570 | 4,097 | 4,708 | 4,509 | 4,604 | 5,223 | 4,705 | 5,005 |
| 2003 | 5,076 | 4,148 | 4,920 | 4,749 | 5,117 | 4,552 | 5,021 | 4,762 | 4,801 | 5,168 | 4,794 | 4,798 |
| 2004 | 4,745 | 3,072 | 3,415 | 4,513 | 4,938 | 4,818 | 5,222 | 5,307 | 4,686 | 4,670 | 4,773 | 5,152 |
| 2005 | 5,116 | 4,862 | 5,490 | 6,067 | 6,197 | 5,863 | 5,990 | 6,082 | 5,803 | 6,109 | 6,012 | 5,744 |
| 2006 | 6,350 | 5,762 | 5,738 | 5,809 | 6,264 | 6,151 | 6,376 | 6,040 | 6,149 | 6,464 | 6,002 | 6,031 |
| 2007 | 5,451 | 5,040 | 6,032 | 5,168 | 6,289 | 5,763 | 6,332 | 6,184 | 5,729 | 5,699 | 6,082 | 5,895 |
| 2008 | 5,812 | 5,325 | 5,306 | 5,499 | 6,662 | 6,561 | 6,279 | 5,558 | 6,770 | 7,162 | 6,012 | 6,688 |
| 2009 | 6,250 | 6,202 | 7,035 | 6,449 | 7,179 | 6,877 | 6,771 | 5,133 | 5,130 | 5,805 | 7,916 | 8,552 |
| 2010 | 7,268 | 6,869 | 8,207 | 8,174 | 9,155 | 9,438 | 9,578 | 9,464 | 10,000 | 10,325 | 10,690 | 11,637 |
| 2011 | 11,046 | 9,617 | 11,840 | 11,095 | 11,591 | 12,045 | 12,614 | 12,666 | 12,776 | 13,069 | 12,440 | 12,048 |
| 2012 | 11,165 | 11,500 | 12,747 | 11,544 | 11,625 | 10,979 | 11,490 | 11,843 | 10,832 | 10,692 | 10,760 | 11,030 |
| 2013 | 10,544 | 9,683 | 11,761 | 11,614 | 12,118 | 11,613 | 11,947 | 12,377 | 11,956 | 11,925 | 11,449 | 11,912 |
| 2014 | 10,241 | 9,527 | 12,650 | 12,295 | 12,783 | 12,812 | 13,287 | 13,585 | 12,667 | 13,272 | 12,750 | 12,964 |
| 2015 | 12,706 | 11,609 | 13,047 | 13,052 | 13,631 | 12,771 | 13,295 | 13,482 | 13,107 | 13,285 | 12,729 | 13,552 |
| 2016 | 12,774 | 12,617 | 14,628 | 14,329 | 14,862 | 14,602 | 15,074 | 14,729 | 14,220 | 14,870 | 14,136 | 14,033 |
| 2017 | 13,225 | 13,136 | 14,327 | 13,779 | 15,355 | 14,749 | 15,102 | 15,577 | 14,450 | 14,553 | 14,235 | 14,019 |
| 2018 | 12,829 | 12,464 | 15,113 | 14,318 | 15,083 | 15,000 | 14,897 | 15,092 | 13,719 | 14,836 | 13,830 | 14,269 |
| 2019 | 13,757 | 12,759 | 13,101 | 13,328 | 15,250 | 14,445 | 15,186 | 14,739 | 13,941 | 14,735 | 14,343 | 14,437 |
| 2020 | 13,952 | 13,156 | 14,048 | 11,133 | 13,495 | 13,668 | 14,395 | 14,158 | 14,019 | 14,343 | 13,296 | 13,771 |
| 2021 | 13,229 | 10,174 | 12,689 | 14,113 | 15,301 | 14,534 | 15,530 | 15,017 | 14,657 | 14,723 | 14,752 | 14,959 |
| 2022 | 13,734 | 13,153 | 15,052 | 14,875 | 15,793 | 15,325 | 15,223 | 15,181 | 14,880 | 15,402 | 14,604 | 14,055 |
| 2023 | 13,630 | 12,860 | 15,055 | 13,377 | 15,263 | 14,126 | 15,342 | 15,423 | 14,988 | 15,394 | 14,349 | 14,880 |
| 2024 | 13,377 | |||||||||||
| - = No Data Reported; -- = Not Applicable; NA = Not Available; W = Withheld to avoid disclosure of individual company data. |
| Release Date: 3/29/2024 |
| Next Release Date: 4/30/2024 |