|
Download Data (XLS File) |
|
||||||||
|
||||||||
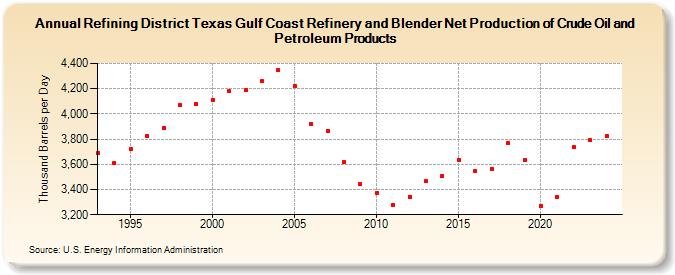
| Refining District Texas Gulf Coast Refinery and Blender Net Production of Crude Oil and Petroleum Products (Thousand Barrels per Day) | ||||||||
| Decade | Year-0 | Year-1 | Year-2 | Year-3 | Year-4 | Year-5 | Year-6 | Year-7 | Year-8 | Year-9 |
|---|---|---|---|---|---|---|---|---|---|---|
| 1990's | 3,688 | 3,609 | 3,719 | 3,821 | 3,890 | 4,071 | 4,079 | |||
| 2000's | 4,114 | 4,178 | 4,186 | 4,258 | 4,347 | 4,221 | 3,919 | 3,867 | 3,619 | 3,440 |
| 2010's | 3,376 | 3,280 | 3,344 | 3,465 | 3,511 | 3,637 | 3,543 | 3,566 | 3,769 | 3,633 |
| 2020's | 3,272 | 3,340 | 3,737 | 3,804 |
| - = No Data Reported; -- = Not Applicable; NA = Not Available; W = Withheld to avoid disclosure of individual company data. |
| Release Date: 3/29/2024 |
| Next Release Date: 8/30/2024 |