|
Download Data (XLS File) |
|
||||||||
|
||||||||
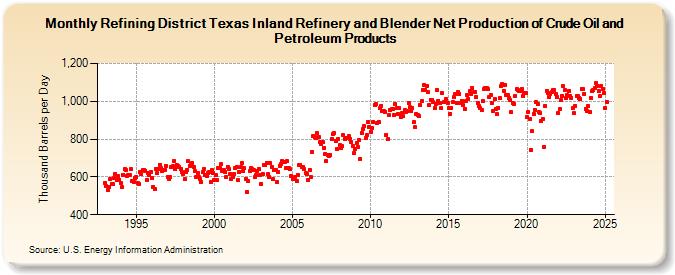
| Refining District Texas Inland Refinery and Blender Net Production of Crude Oil and Petroleum Products (Thousand Barrels per Day) | ||||||||
| Year | Jan | Feb | Mar | Apr | May | Jun | Jul | Aug | Sep | Oct | Nov | Dec |
|---|---|---|---|---|---|---|---|---|---|---|---|---|
| 1993 | 570 | 553 | 529 | 548 | 588 | 564 | 560 | 592 | 616 | 583 | 604 | 585 |
| 1994 | 566 | 546 | 612 | 640 | 639 | 607 | 608 | 610 | 640 | 580 | 571 | 593 |
| 1995 | 601 | 566 | 564 | 627 | 613 | 636 | 637 | 632 | 581 | 621 | 610 | 624 |
| 1996 | 593 | 548 | 534 | 644 | 620 | 642 | 665 | 647 | 629 | 634 | 639 | 660 |
| 1997 | 599 | 590 | 597 | 651 | 656 | 683 | 643 | 664 | 656 | 651 | 644 | 628 |
| 1998 | 617 | 587 | 627 | 638 | 683 | 660 | 665 | 672 | 654 | 629 | 598 | 623 |
| 1999 | 598 | 590 | 572 | 625 | 642 | 611 | 604 | 619 | 626 | 574 | 634 | 622 |
| 2000 | 586 | 608 | 581 | 648 | 649 | 668 | 633 | 638 | 626 | 602 | 655 | 644 |
| 2001 | 616 | 590 | 600 | 616 | 646 | 652 | 585 | 628 | 651 | 676 | 629 | 645 |
| 2002 | 591 | 521 | 578 | 630 | 645 | 642 | 635 | 600 | 609 | 630 | 642 | 610 |
| 2003 | 561 | 613 | 664 | 664 | 676 | 614 | 601 | 672 | 655 | 588 | 635 | 635 |
| 2004 | 574 | 627 | 660 | 669 | 683 | 678 | 681 | 646 | 682 | 647 | 640 | 607 |
| 2005 | 589 | 588 | 602 | 576 | 609 | 661 | 665 | 653 | 652 | 641 | 619 | 614 |
| 2006 | 586 | 638 | 600 | 734 | 817 | 810 | 807 | 830 | 812 | 783 | 772 | 783 |
| 2007 | 755 | 723 | 683 | 716 | 711 | 718 | 801 | 826 | 830 | 788 | 747 | 803 |
| 2008 | 767 | 751 | 761 | 820 | 803 | 804 | 808 | 815 | 801 | 787 | 765 | 725 |
| 2009 | 748 | 780 | 760 | 795 | 696 | 831 | 856 | 868 | 807 | 820 | 893 | 866 |
| 2010 | 839 | 859 | 893 | 982 | 986 | 885 | 892 | 962 | 977 | 947 | 951 | 945 |
| 2011 | 824 | 798 | 925 | 956 | 957 | 961 | 929 | 984 | 966 | 933 | 964 | 916 |
| 2012 | 936 | 920 | 954 | 943 | 947 | 990 | 968 | 949 | 967 | 888 | 862 | 933 |
| 2013 | 929 | 922 | 979 | 999 | 1,059 | 1,086 | 1,060 | 1,083 | 1,049 | 981 | 1,008 | 1,006 |
| 2014 | 994 | 962 | 986 | 1,059 | 1,004 | 992 | 962 | 1,043 | 994 | 998 | 1,011 | 990 |
| 2015 | 963 | 934 | 966 | 997 | 1,024 | 1,036 | 993 | 1,050 | 1,040 | 991 | 1,004 | 980 |
| 2016 | 960 | 1,001 | 1,032 | 1,014 | 1,052 | 1,039 | 1,069 | 1,048 | 1,051 | 1,024 | 993 | 976 |
| 2017 | 962 | 953 | 1,004 | 1,064 | 1,068 | 1,072 | 1,064 | 1,024 | 1,033 | 991 | 948 | 1,011 |
| 2018 | 959 | 931 | 965 | 1,016 | 1,079 | 1,091 | 1,056 | 1,086 | 1,032 | 1,035 | 1,018 | 1,006 |
| 2019 | 944 | 989 | 986 | 1,028 | 1,063 | 1,060 | 1,053 | 1,055 | 1,066 | 1,030 | 1,045 | 1,044 |
| 2020 | 918 | 942 | 906 | 744 | 841 | 934 | 956 | 995 | 985 | 942 | 940 | 898 |
| 2021 | 908 | 759 | 975 | 1,055 | 1,045 | 1,022 | 1,040 | 1,047 | 1,060 | 1,059 | 1,036 | 1,024 |
| 2022 | 938 | 957 | 1,005 | 1,030 | 1,079 | 1,061 | 1,015 | 1,031 | 1,055 | 1,029 | 1,020 | 963 |
| 2023 | 933 | 967 | 1,027 | 1,029 | 1,018 | 1,015 | 1,066 | 1,064 | 1,043 | 961 | 949 | 971 |
| 2024 | 944 | |||||||||||
| - = No Data Reported; -- = Not Applicable; NA = Not Available; W = Withheld to avoid disclosure of individual company data. |
| Release Date: 3/29/2024 |
| Next Release Date: 4/30/2024 |