|
Download Data (XLS File) |
|
||||||||
|
||||||||
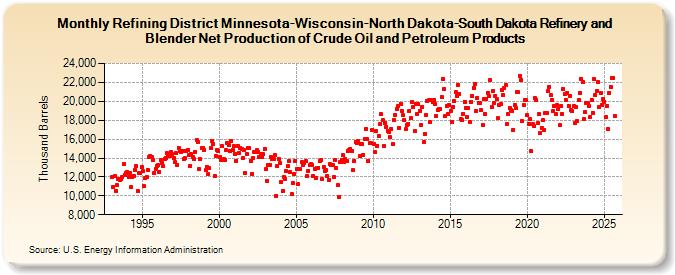
| Refining District Minnesota-Wisconsin-North Dakota-South Dakota Refinery and Blender Net Production of Crude Oil and Petroleum Products (Thousand Barrels) | ||||||||
| Year | Jan | Feb | Mar | Apr | May | Jun | Jul | Aug | Sep | Oct | Nov | Dec |
|---|---|---|---|---|---|---|---|---|---|---|---|---|
| 1993 | 11,976 | 10,933 | 12,067 | 10,553 | 11,094 | 11,810 | 11,705 | 11,799 | 11,998 | 13,320 | 12,203 | 12,462 |
| 1994 | 12,507 | 12,005 | 12,377 | 10,920 | 11,984 | 12,098 | 12,775 | 13,139 | 10,501 | 12,383 | 12,425 | 13,003 |
| 1995 | 12,590 | 10,994 | 11,854 | 12,000 | 12,751 | 14,073 | 14,220 | 14,068 | 13,745 | 12,462 | 12,874 | 13,140 |
| 1996 | 13,274 | 12,568 | 13,804 | 13,467 | 13,118 | 13,932 | 14,041 | 14,484 | 14,172 | 14,245 | 14,626 | 14,384 |
| 1997 | 14,036 | 13,531 | 14,495 | 13,277 | 15,090 | 14,711 | 14,661 | 14,759 | 13,848 | 13,988 | 14,699 | 14,850 |
| 1998 | 14,265 | 13,180 | 14,390 | 14,067 | 13,878 | 14,676 | 15,940 | 15,720 | 12,792 | 13,894 | 15,057 | 15,058 |
| 1999 | 14,867 | 12,685 | 13,094 | 12,284 | 12,897 | 15,108 | 15,851 | 15,465 | 12,064 | 14,195 | 14,892 | 14,758 |
| 2000 | 14,129 | 13,763 | 15,223 | 13,908 | 13,740 | 14,885 | 15,584 | 15,395 | 14,696 | 15,814 | 14,869 | 15,267 |
| 2001 | 14,438 | 13,735 | 15,306 | 14,534 | 15,082 | 14,948 | 13,978 | 14,813 | 12,433 | 14,425 | 15,111 | 15,053 |
| 2002 | 13,672 | 12,350 | 14,032 | 14,638 | 14,646 | 14,794 | 14,659 | 14,157 | 14,374 | 14,114 | 14,371 | 14,951 |
| 2003 | 12,803 | 11,551 | 13,225 | 13,284 | 14,113 | 13,936 | 13,891 | 14,269 | 9,999 | 13,102 | 13,926 | 13,467 |
| 2004 | 11,482 | 10,492 | 11,958 | 11,783 | 12,623 | 13,107 | 13,634 | 12,512 | 10,159 | 11,304 | 12,324 | 13,729 |
| 2005 | 12,843 | 11,212 | 12,791 | 12,801 | 13,555 | 13,302 | 13,484 | 13,691 | 12,093 | 12,661 | 13,234 | 13,327 |
| 2006 | 13,227 | 12,089 | 12,882 | 11,842 | 12,987 | 12,984 | 13,688 | 13,801 | 11,733 | 13,005 | 12,655 | 12,695 |
| 2007 | 12,115 | 11,706 | 13,333 | 13,210 | 13,261 | 11,979 | 13,765 | 12,946 | 11,111 | 9,876 | 13,618 | 13,807 |
| 2008 | 14,271 | 13,564 | 13,869 | 13,711 | 14,781 | 14,816 | 14,990 | 14,788 | 12,679 | 13,729 | 15,699 | 15,604 |
| 2009 | 15,845 | 14,178 | 15,461 | 15,505 | 14,366 | 16,019 | 17,110 | 16,004 | 13,703 | 15,590 | 15,594 | 16,995 |
| 2010 | 15,460 | 14,630 | 16,815 | 15,317 | 16,289 | 17,613 | 18,618 | 17,988 | 15,297 | 17,706 | 17,329 | 16,846 |
| 2011 | 16,748 | 16,182 | 17,082 | 15,474 | 18,029 | 18,577 | 19,204 | 19,483 | 17,187 | 19,757 | 19,009 | 18,513 |
| 2012 | 17,992 | 17,024 | 17,463 | 17,605 | 18,996 | 18,199 | 19,879 | 19,423 | 16,829 | 19,681 | 18,686 | 19,715 |
| 2013 | 19,011 | 17,539 | 19,401 | 15,664 | 16,562 | 18,593 | 20,024 | 20,093 | 17,801 | 20,088 | 19,893 | 20,147 |
| 2014 | 19,715 | 18,465 | 19,100 | 19,163 | 19,181 | 20,436 | 22,369 | 21,326 | 18,476 | 19,540 | 18,673 | 19,633 |
| 2015 | 18,970 | 17,824 | 19,442 | 20,001 | 20,938 | 20,600 | 21,772 | 20,806 | 18,118 | 17,980 | 18,696 | 19,969 |
| 2016 | 19,295 | 18,319 | 19,307 | 17,848 | 19,976 | 20,599 | 21,430 | 21,840 | 18,977 | 20,377 | 19,819 | 19,835 |
| 2017 | 19,047 | 17,524 | 20,200 | 18,656 | 20,199 | 20,911 | 20,516 | 22,226 | 19,384 | 21,072 | 19,794 | 20,601 |
| 2018 | 20,197 | 18,186 | 19,626 | 19,685 | 21,196 | 20,688 | 21,429 | 21,714 | 17,620 | 18,624 | 19,243 | 19,098 |
| 2019 | 18,993 | 17,006 | 19,652 | 19,306 | 20,978 | 20,944 | 22,727 | 22,285 | 17,912 | 19,604 | 20,143 | 20,102 |
| 2020 | 18,514 | 17,650 | 18,107 | 14,701 | 17,547 | 17,359 | 20,309 | 20,172 | 17,668 | 18,660 | 16,662 | 17,186 |
| 2021 | 17,982 | 17,013 | 18,774 | 18,752 | 21,054 | 21,556 | 20,621 | 20,178 | 18,996 | 19,462 | 18,671 | 19,599 |
| 2022 | 19,142 | 17,451 | 19,519 | 18,694 | 21,291 | 20,743 | 20,122 | 20,881 | 19,540 | 20,583 | 19,036 | 18,976 |
| 2023 | 19,472 | 17,736 | 19,423 | 17,861 | 20,141 | 20,878 | 22,349 | 22,026 | 18,115 | 18,829 | 19,839 | 19,835 |
| 2024 | 19,519 | |||||||||||
| - = No Data Reported; -- = Not Applicable; NA = Not Available; W = Withheld to avoid disclosure of individual company data. |
| Release Date: 3/29/2024 |
| Next Release Date: 4/30/2024 |