|
Download Data (XLS File) |
|
||||||||
|
||||||||
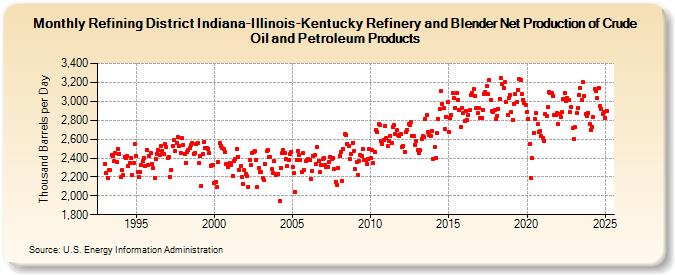
| Refining District Indiana-Illinois-Kentucky Refinery and Blender Net Production of Crude Oil and Petroleum Products (Thousand Barrels per Day) | ||||||||
| Year | Jan | Feb | Mar | Apr | May | Jun | Jul | Aug | Sep | Oct | Nov | Dec |
|---|---|---|---|---|---|---|---|---|---|---|---|---|
| 1993 | 2,340 | 2,240 | 2,192 | 2,272 | 2,272 | 2,427 | 2,416 | 2,363 | 2,451 | 2,362 | 2,494 | 2,445 |
| 1994 | 2,194 | 2,269 | 2,217 | 2,412 | 2,399 | 2,420 | 2,316 | 2,343 | 2,401 | 2,225 | 2,347 | 2,547 |
| 1995 | 2,421 | 2,253 | 2,194 | 2,252 | 2,324 | 2,365 | 2,397 | 2,313 | 2,483 | 2,326 | 2,425 | 2,452 |
| 1996 | 2,332 | 2,291 | 2,189 | 2,388 | 2,447 | 2,480 | 2,428 | 2,525 | 2,478 | 2,439 | 2,551 | 2,512 |
| 1997 | 2,402 | 2,410 | 2,204 | 2,273 | 2,532 | 2,591 | 2,471 | 2,557 | 2,619 | 2,522 | 2,455 | 2,609 |
| 1998 | 2,540 | 2,447 | 2,352 | 2,461 | 2,482 | 2,504 | 2,537 | 2,558 | 2,445 | 2,458 | 2,550 | 2,562 |
| 1999 | 2,345 | 2,417 | 2,107 | 2,446 | 2,572 | 2,501 | 2,507 | 2,493 | 2,451 | 2,320 | 2,326 | 2,325 |
| 2000 | 2,136 | 2,151 | 2,097 | 2,358 | 2,558 | 2,526 | 2,510 | 2,496 | 2,463 | 2,337 | 2,301 | 2,337 |
| 2001 | 2,343 | 2,326 | 2,207 | 2,369 | 2,390 | 2,500 | 2,414 | 2,277 | 2,318 | 2,195 | 2,124 | 2,270 |
| 2002 | 2,228 | 2,206 | 2,097 | 2,380 | 2,325 | 2,450 | 2,463 | 2,469 | 2,384 | 2,089 | 2,292 | 2,254 |
| 2003 | 2,252 | 2,192 | 2,164 | 2,334 | 2,472 | 2,484 | 2,415 | 2,412 | 2,279 | 2,244 | 2,363 | 2,222 |
| 2004 | 2,233 | 2,235 | 1,945 | 2,292 | 2,448 | 2,486 | 2,449 | 2,385 | 2,316 | 2,383 | 2,438 | 2,468 |
| 2005 | 2,309 | 2,240 | 2,043 | 2,381 | 2,472 | 2,432 | 2,378 | 2,254 | 2,450 | 2,276 | 2,363 | 2,378 |
| 2006 | 2,387 | 2,375 | 2,182 | 2,259 | 2,420 | 2,432 | 2,339 | 2,516 | 2,370 | 2,257 | 2,327 | 2,385 |
| 2007 | 2,396 | 2,328 | 2,306 | 2,305 | 2,362 | 2,413 | 2,389 | 2,400 | 2,282 | 2,149 | 2,118 | 2,291 |
| 2008 | 2,426 | 2,466 | 2,161 | 2,496 | 2,650 | 2,647 | 2,552 | 2,530 | 2,391 | 2,444 | 2,557 | 2,475 |
| 2009 | 2,279 | 2,356 | 2,216 | 2,368 | 2,430 | 2,425 | 2,494 | 2,375 | 2,374 | 2,339 | 2,387 | 2,495 |
| 2010 | 2,400 | 2,480 | 2,345 | 2,460 | 2,701 | 2,676 | 2,759 | 2,745 | 2,584 | 2,549 | 2,586 | 2,743 |
| 2011 | 2,609 | 2,531 | 2,585 | 2,632 | 2,560 | 2,733 | 2,751 | 2,654 | 2,693 | 2,643 | 2,632 | 2,656 |
| 2012 | 2,516 | 2,530 | 2,467 | 2,672 | 2,699 | 2,757 | 2,753 | 2,776 | 2,629 | 2,630 | 2,538 | 2,580 |
| 2013 | 2,484 | 2,451 | 2,483 | 2,601 | 2,632 | 2,619 | 2,812 | 2,857 | 2,676 | 2,646 | 2,633 | 2,690 |
| 2014 | 2,389 | 2,514 | 2,403 | 2,668 | 2,810 | 2,918 | 3,109 | 2,972 | 2,926 | 2,706 | 2,838 | 2,988 |
| 2015 | 2,674 | 2,820 | 2,857 | 3,085 | 3,034 | 2,934 | 3,092 | 3,013 | 2,908 | 2,728 | 2,927 | 2,877 |
| 2016 | 2,789 | 2,899 | 2,803 | 2,856 | 2,911 | 3,064 | 3,088 | 3,130 | 3,055 | 2,934 | 2,879 | 2,925 |
| 2017 | 2,827 | 2,821 | 2,913 | 3,072 | 3,103 | 3,162 | 3,076 | 3,226 | 3,013 | 2,892 | 2,886 | 2,910 |
| 2018 | 2,809 | 2,847 | 2,923 | 3,026 | 3,242 | 3,184 | 3,144 | 3,199 | 2,997 | 2,860 | 3,038 | 3,071 |
| 2019 | 2,882 | 2,804 | 2,973 | 3,079 | 2,995 | 3,121 | 3,237 | 3,229 | 3,078 | 3,017 | 2,985 | 2,966 |
| 2020 | 2,886 | 2,817 | 2,551 | 2,189 | 2,405 | 2,668 | 2,816 | 2,875 | 2,757 | 2,674 | 2,682 | 2,633 |
| 2021 | 2,610 | 2,582 | 2,864 | 2,848 | 2,936 | 3,101 | 3,083 | 3,085 | 3,056 | 2,860 | 2,860 | 2,877 |
| 2022 | 2,756 | 2,864 | 2,830 | 2,885 | 3,029 | 3,088 | 3,007 | 3,034 | 3,015 | 2,882 | 2,939 | 2,714 |
| 2023 | 2,598 | 2,724 | 2,872 | 2,931 | 3,071 | 3,143 | 3,014 | 3,199 | 3,059 | 2,870 | 2,842 | 2,881 |
| 2024 | 2,757 | 2,695 | 2,733 | 2,837 | 3,128 | 3,111 | 3,032 | 3,145 | 2,950 | 2,918 | 2,866 | 2,888 |
| 2025 | 2,826 | 2,896 | 2,974 | 3,079 | ||||||||
| - = No Data Reported; -- = Not Applicable; NA = Not Available; W = Withheld to avoid disclosure of individual company data. |
| Release Date: 6/30/2025 |
| Next Release Date: 7/31/2025 |