|
Download Data (XLS File) |
|
||||||||
|
||||||||
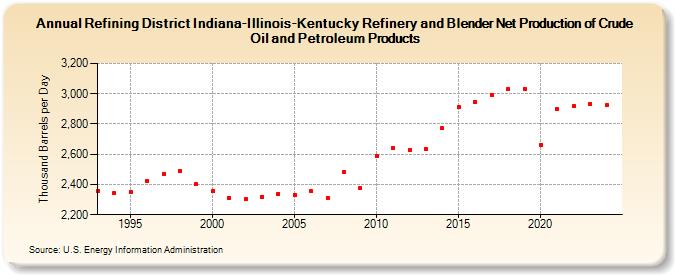
| Refining District Indiana-Illinois-Kentucky Refinery and Blender Net Production of Crude Oil and Petroleum Products (Thousand Barrels per Day) | ||||||||
| Decade | Year-0 | Year-1 | Year-2 | Year-3 | Year-4 | Year-5 | Year-6 | Year-7 | Year-8 | Year-9 |
|---|---|---|---|---|---|---|---|---|---|---|
| 1990's | 2,357 | 2,341 | 2,351 | 2,422 | 2,471 | 2,492 | 2,400 | |||
| 2000's | 2,356 | 2,311 | 2,303 | 2,320 | 2,340 | 2,331 | 2,354 | 2,312 | 2,483 | 2,378 |
| 2010's | 2,587 | 2,640 | 2,629 | 2,634 | 2,771 | 2,912 | 2,944 | 2,993 | 3,029 | 3,032 |
| 2020's | 2,663 | 2,899 | 2,920 | 2,935 |
| - = No Data Reported; -- = Not Applicable; NA = Not Available; W = Withheld to avoid disclosure of individual company data. |
| Release Date: 3/29/2024 |
| Next Release Date: 8/30/2024 |