|
Download Data (XLS File) |
|
||||||||
|
||||||||
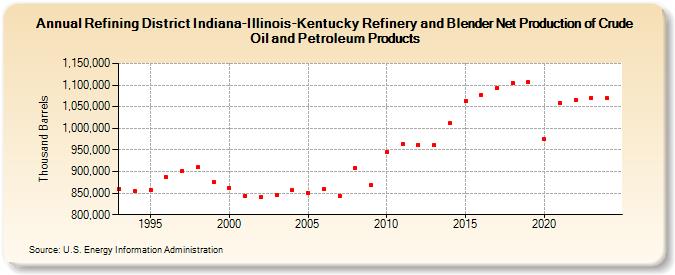
| Refining District Indiana-Illinois-Kentucky Refinery and Blender Net Production of Crude Oil and Petroleum Products (Thousand Barrels) | ||||||||
| Decade | Year-0 | Year-1 | Year-2 | Year-3 | Year-4 | Year-5 | Year-6 | Year-7 | Year-8 | Year-9 |
|---|---|---|---|---|---|---|---|---|---|---|
| 1990's | 860,143 | 854,419 | 857,976 | 886,362 | 901,792 | 909,499 | 876,146 | |||
| 2000's | 862,424 | 843,457 | 840,634 | 846,758 | 856,397 | 850,840 | 859,211 | 843,850 | 908,630 | 868,024 |
| 2010's | 944,112 | 963,779 | 962,328 | 961,262 | 1,011,544 | 1,063,059 | 1,077,685 | 1,092,367 | 1,105,714 | 1,106,636 |
| 2020's | 974,606 | 1,057,981 | 1,065,796 | 1,071,163 |
| - = No Data Reported; -- = Not Applicable; NA = Not Available; W = Withheld to avoid disclosure of individual company data. |
| Release Date: 8/30/2024 |
| Next Release Date: 8/29/2025 |