|
Download Data (XLS File) |
|
||||||||
|
||||||||
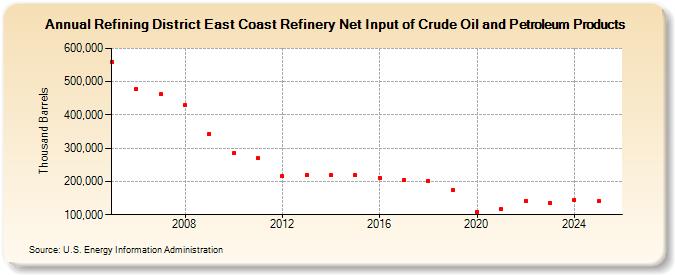
| Refining District East Coast Refinery Net Input of Crude Oil and Petroleum Products (Thousand Barrels) | ||||||||
| Decade | Year-0 | Year-1 | Year-2 | Year-3 | Year-4 | Year-5 | Year-6 | Year-7 | Year-8 | Year-9 |
|---|---|---|---|---|---|---|---|---|---|---|
| 2000's | 559,088 | 477,853 | 462,110 | 428,336 | 343,453 | |||||
| 2010's | 285,498 | 269,441 | 215,760 | 218,916 | 218,142 | 218,229 | 211,529 | 203,541 | 201,037 | 172,906 |
| 2020's | 108,942 | 116,015 | 142,598 | 136,251 |
| - = No Data Reported; -- = Not Applicable; NA = Not Available; W = Withheld to avoid disclosure of individual company data. |
| Release Date: 3/29/2024 |
| Next Release Date: 8/30/2024 |