|
Download Data (XLS File) |
|
||||||||
|
||||||||
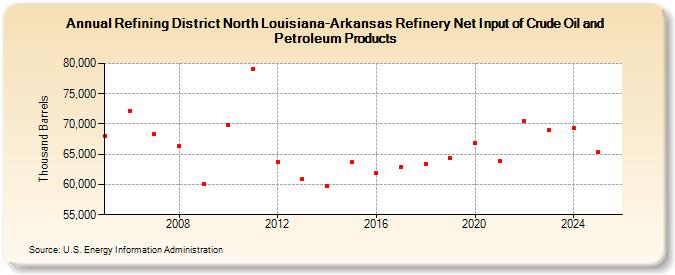
| Refining District North Louisiana-Arkansas Refinery Net Input of Crude Oil and Petroleum Products (Thousand Barrels) | ||||||||
| Decade | Year-0 | Year-1 | Year-2 | Year-3 | Year-4 | Year-5 | Year-6 | Year-7 | Year-8 | Year-9 |
|---|---|---|---|---|---|---|---|---|---|---|
| 2000's | 67,938 | 72,193 | 68,337 | 66,309 | 60,146 | |||||
| 2010's | 69,815 | 79,070 | 63,778 | 60,834 | 59,666 | 63,676 | 61,825 | 62,907 | 63,433 | 64,448 |
| 2020's | 66,888 | 63,857 | 70,520 | 68,960 |
| - = No Data Reported; -- = Not Applicable; NA = Not Available; W = Withheld to avoid disclosure of individual company data. |
| Release Date: 8/30/2024 |
| Next Release Date: 8/29/2025 |