|
Download Data (XLS File) |
|
||||||||
|
||||||||
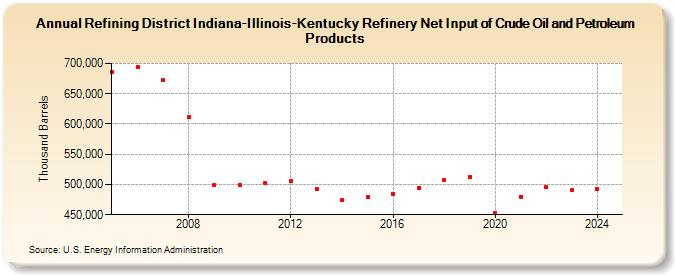
| Refining District Indiana-Illinois-Kentucky Refinery Net Input of Crude Oil and Petroleum Products (Thousand Barrels) | ||||||||
| Decade | Year-0 | Year-1 | Year-2 | Year-3 | Year-4 | Year-5 | Year-6 | Year-7 | Year-8 | Year-9 |
|---|---|---|---|---|---|---|---|---|---|---|
| 2000's | 685,525 | 693,963 | 671,965 | 611,443 | 498,512 | |||||
| 2010's | 499,784 | 501,786 | 506,450 | 492,646 | 474,147 | 479,895 | 484,826 | 494,888 | 508,027 | 511,525 |
| 2020's | 452,694 | 480,016 | 495,167 | 489,992 |
| - = No Data Reported; -- = Not Applicable; NA = Not Available; W = Withheld to avoid disclosure of individual company data. |
| Release Date: 3/29/2024 |
| Next Release Date: 8/30/2024 |