|
Download Data (XLS File) |
|
||||||||
|
||||||||
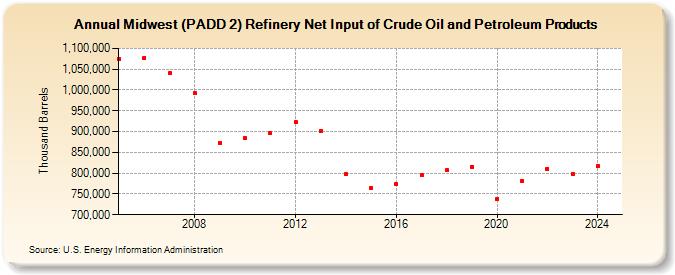
| Midwest (PADD 2) Refinery Net Input of Crude Oil and Petroleum Products (Thousand Barrels) | ||||||||
| Decade | Year-0 | Year-1 | Year-2 | Year-3 | Year-4 | Year-5 | Year-6 | Year-7 | Year-8 | Year-9 |
|---|---|---|---|---|---|---|---|---|---|---|
| 2000's | 1,074,686 | 1,078,061 | 1,040,102 | 992,713 | 873,259 | |||||
| 2010's | 883,865 | 895,998 | 923,423 | 901,937 | 797,470 | 764,734 | 773,837 | 794,877 | 807,398 | 815,804 |
| 2020's | 737,639 | 781,130 | 810,749 | 798,438 |
| - = No Data Reported; -- = Not Applicable; NA = Not Available; W = Withheld to avoid disclosure of individual company data. |
| Release Date: 6/28/2024 |
| Next Release Date: 8/30/2024 |