|
Download Data (XLS File) |
|
||||||||
|
||||||||
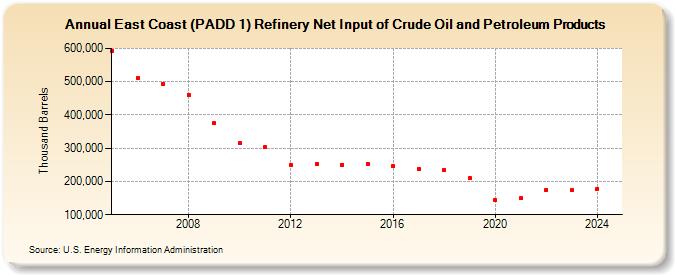
| East Coast (PADD 1) Refinery Net Input of Crude Oil and Petroleum Products (Thousand Barrels) | ||||||||
| Decade | Year-0 | Year-1 | Year-2 | Year-3 | Year-4 | Year-5 | Year-6 | Year-7 | Year-8 | Year-9 |
|---|---|---|---|---|---|---|---|---|---|---|
| 2000's | 592,786 | 511,344 | 493,452 | 460,645 | 375,271 | |||||
| 2010's | 314,717 | 302,272 | 250,176 | 252,222 | 250,410 | 252,951 | 246,427 | 237,634 | 235,312 | 209,040 |
| 2020's | 143,704 | 149,197 | 174,344 | 172,769 |
| - = No Data Reported; -- = Not Applicable; NA = Not Available; W = Withheld to avoid disclosure of individual company data. |
| Release Date: 6/28/2024 |
| Next Release Date: 8/30/2024 |