|
Download Data (XLS File) |
|
||||||||
|
||||||||
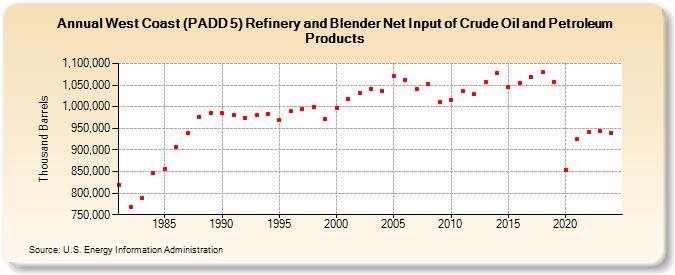
| West Coast (PADD 5) Refinery and Blender Net Input of Crude Oil and Petroleum Products (Thousand Barrels) | ||||||||
| Decade | Year-0 | Year-1 | Year-2 | Year-3 | Year-4 | Year-5 | Year-6 | Year-7 | Year-8 | Year-9 |
|---|---|---|---|---|---|---|---|---|---|---|
| 1980's | 819,336 | 767,134 | 788,580 | 845,742 | 855,393 | 906,155 | 938,072 | 977,283 | 986,516 | |
| 1990's | 984,768 | 980,494 | 974,139 | 979,934 | 982,716 | 968,911 | 989,703 | 993,588 | 998,863 | 971,235 |
| 2000's | 997,192 | 1,018,873 | 1,030,820 | 1,041,404 | 1,037,327 | 1,070,260 | 1,061,978 | 1,041,048 | 1,052,351 | 1,010,275 |
| 2010's | 1,014,546 | 1,036,118 | 1,028,754 | 1,056,298 | 1,077,034 | 1,046,312 | 1,054,849 | 1,068,695 | 1,079,611 | 1,057,734 |
| 2020's | 854,382 | 925,077 | 941,073 | 943,696 |
| - = No Data Reported; -- = Not Applicable; NA = Not Available; W = Withheld to avoid disclosure of individual company data. |
| Release Date: 3/29/2024 |
| Next Release Date: 8/30/2024 |