|
Download Data (XLS File) |
|
||||||||
|
||||||||
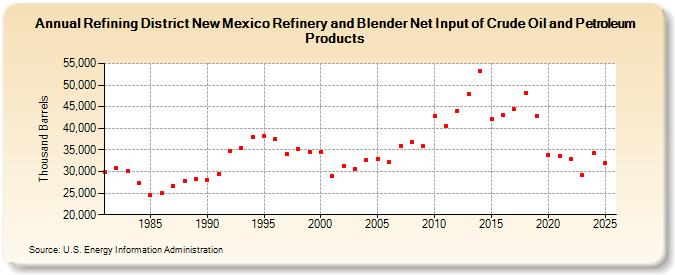
| Refining District New Mexico Refinery and Blender Net Input of Crude Oil and Petroleum Products (Thousand Barrels) | ||||||||
| Decade | Year-0 | Year-1 | Year-2 | Year-3 | Year-4 | Year-5 | Year-6 | Year-7 | Year-8 | Year-9 |
|---|---|---|---|---|---|---|---|---|---|---|
| 1980's | 29,971 | 30,721 | 30,194 | 27,291 | 24,494 | 25,034 | 26,725 | 27,854 | 28,348 | |
| 1990's | 28,066 | 29,510 | 34,845 | 35,442 | 38,073 | 38,150 | 37,610 | 34,004 | 35,293 | 34,459 |
| 2000's | 34,412 | 28,938 | 31,280 | 30,466 | 32,719 | 32,894 | 32,121 | 36,006 | 36,828 | 35,853 |
| 2010's | 42,880 | 40,606 | 43,953 | 47,842 | 53,223 | 42,158 | 43,185 | 44,433 | 48,274 | 42,914 |
| 2020's | 33,729 | 33,665 | 32,907 | 29,191 |
| - = No Data Reported; -- = Not Applicable; NA = Not Available; W = Withheld to avoid disclosure of individual company data. |
| Release Date: 3/29/2024 |
| Next Release Date: 8/30/2024 |