|
Download Data (XLS File) |
|
||||||||
|
||||||||
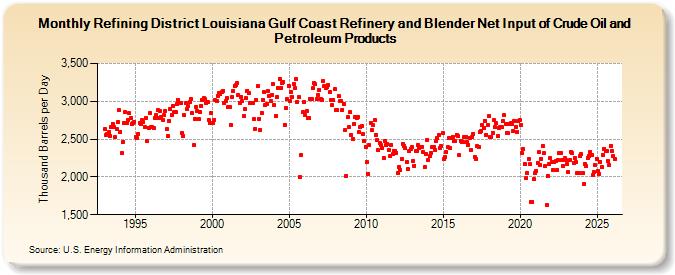
| Refining District Louisiana Gulf Coast Refinery and Blender Net Input of Crude Oil and Petroleum Products (Thousand Barrels per Day) | ||||||||
| Year | Jan | Feb | Mar | Apr | May | Jun | Jul | Aug | Sep | Oct | Nov | Dec |
|---|---|---|---|---|---|---|---|---|---|---|---|---|
| 1993 | 2,629 | 2,555 | 2,574 | 2,595 | 2,546 | 2,665 | 2,705 | 2,660 | 2,523 | 2,638 | 2,727 | 2,880 |
| 1994 | 2,598 | 2,310 | 2,460 | 2,711 | 2,856 | 2,716 | 2,747 | 2,840 | 2,779 | 2,697 | 2,716 | 2,731 |
| 1995 | 2,530 | 2,510 | 2,569 | 2,716 | 2,704 | 2,750 | 2,727 | 2,664 | 2,775 | 2,475 | 2,652 | 2,841 |
| 1996 | 2,664 | 2,656 | 2,643 | 2,778 | 2,818 | 2,880 | 2,782 | 2,871 | 2,788 | 2,759 | 2,815 | 2,873 |
| 1997 | 2,627 | 2,545 | 2,744 | 2,898 | 2,822 | 2,943 | 2,859 | 2,857 | 2,959 | 3,021 | 2,983 | 2,976 |
| 1998 | 2,585 | 2,543 | 2,813 | 2,978 | 2,902 | 2,933 | 2,989 | 3,029 | 2,843 | 2,421 | 2,771 | 2,925 |
| 1999 | 2,869 | 2,762 | 2,856 | 2,943 | 3,023 | 3,039 | 3,027 | 2,983 | 2,987 | 2,750 | 2,707 | 2,850 |
| 2000 | 2,714 | 2,759 | 3,011 | 3,002 | 3,076 | 3,115 | 3,090 | 3,123 | 3,138 | 2,973 | 2,998 | 3,046 |
| 2001 | 2,928 | 2,924 | 2,689 | 3,060 | 3,137 | 3,204 | 3,210 | 3,239 | 3,078 | 2,981 | 3,063 | 2,998 |
| 2002 | 2,800 | 2,901 | 3,038 | 3,141 | 3,106 | 2,981 | 2,983 | 2,983 | 2,761 | 2,634 | 3,021 | 3,200 |
| 2003 | 2,772 | 2,626 | 2,849 | 3,018 | 3,121 | 2,946 | 2,965 | 3,137 | 3,074 | 3,002 | 3,087 | 3,231 |
| 2004 | 2,948 | 2,803 | 3,054 | 3,170 | 3,296 | 3,182 | 3,240 | 3,257 | 2,692 | 2,912 | 3,026 | 3,208 |
| 2005 | 3,009 | 3,125 | 3,054 | 3,230 | 3,172 | 3,289 | 2,995 | 3,051 | 1,998 | 2,292 | 2,853 | 2,986 |
| 2006 | 2,814 | 2,865 | 2,773 | 2,775 | 3,035 | 3,027 | 3,171 | 3,238 | 3,224 | 3,024 | 3,086 | 3,155 |
| 2007 | 3,032 | 3,021 | 3,266 | 3,202 | 3,176 | 3,186 | 3,218 | 3,124 | 3,016 | 2,950 | 3,017 | 3,157 |
| 2008 | 2,891 | 2,884 | 3,068 | 3,003 | 2,999 | 2,891 | 2,961 | 2,618 | 2,017 | 2,787 | 2,654 | 2,855 |
| 2009 | 2,556 | 2,499 | 2,697 | 2,794 | 2,774 | 2,793 | 2,592 | 2,655 | 2,670 | 2,561 | 2,475 | 2,399 |
| 2010 | 2,197 | 2,042 | 2,422 | 2,718 | 2,614 | 2,683 | 2,749 | 2,560 | 2,488 | 2,350 | 2,454 | 2,420 |
| 2011 | 2,377 | 2,256 | 2,470 | 2,418 | 2,436 | 2,355 | 2,280 | 2,423 | 2,299 | 2,348 | 2,339 | 2,322 |
| 2012 | 2,054 | 2,127 | 2,091 | 2,239 | 2,436 | 2,414 | 2,382 | 2,200 | 2,098 | 2,337 | 2,375 | 2,390 |
| 2013 | 2,212 | 2,149 | 2,344 | 2,346 | 2,425 | 2,386 | 2,392 | 2,396 | 2,329 | 2,129 | 2,303 | 2,490 |
| 2014 | 2,227 | 2,271 | 2,322 | 2,391 | 2,392 | 2,361 | 2,473 | 2,512 | 2,557 | 2,380 | 2,412 | 2,579 |
| 2015 | 2,231 | 2,262 | 2,327 | 2,390 | 2,511 | 2,378 | 2,518 | 2,534 | 2,473 | 2,478 | 2,558 | 2,544 |
| 2016 | 2,286 | 2,479 | 2,461 | 2,464 | 2,529 | 2,528 | 2,462 | 2,426 | 2,520 | 2,360 | 2,534 | 2,574 |
| 2017 | 2,267 | 2,243 | 2,403 | 2,392 | 2,596 | 2,613 | 2,687 | 2,652 | 2,742 | 2,556 | 2,680 | 2,801 |
| 2018 | 2,525 | 2,531 | 2,587 | 2,749 | 2,659 | 2,708 | 2,541 | 2,648 | 2,655 | 2,658 | 2,740 | 2,816 |
| 2019 | 2,705 | 2,585 | 2,576 | 2,705 | 2,709 | 2,698 | 2,607 | 2,744 | 2,662 | 2,596 | 2,733 | 2,754 |
| 2020 | 2,690 | 2,314 | 2,367 | 2,171 | 1,984 | 2,054 | 2,236 | 2,168 | 1,674 | 1,671 | 1,966 | 2,050 |
| 2021 | 2,080 | 2,190 | 2,325 | 2,154 | 2,243 | 2,409 | 2,312 | 2,143 | 1,629 | 2,017 | 2,167 | 2,245 |
| 2022 | 2,201 | 2,091 | 2,198 | 2,204 | 2,091 | 2,218 | 2,321 | 2,321 | 2,217 | 2,145 | 2,245 | 2,230 |
| 2023 | 2,165 | 2,062 | 2,219 | 2,334 | 2,306 | 2,171 | 2,220 | 2,192 | 2,058 | 2,049 | 2,274 | 2,299 |
| 2024 | 2,084 | |||||||||||
| - = No Data Reported; -- = Not Applicable; NA = Not Available; W = Withheld to avoid disclosure of individual company data. |
| Release Date: 3/29/2024 |
| Next Release Date: 4/30/2024 |