|
Download Data (XLS File) |
|
||||||||
|
||||||||
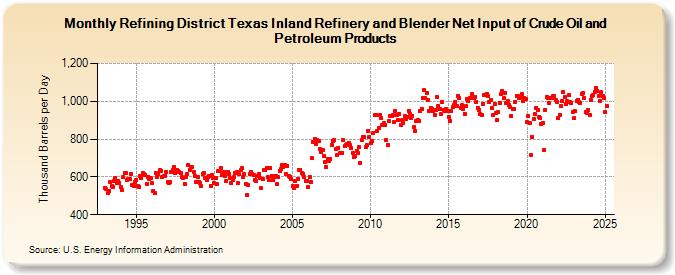
| Refining District Texas Inland Refinery and Blender Net Input of Crude Oil and Petroleum Products (Thousand Barrels per Day) | ||||||||
| Year | Jan | Feb | Mar | Apr | May | Jun | Jul | Aug | Sep | Oct | Nov | Dec |
|---|---|---|---|---|---|---|---|---|---|---|---|---|
| 1993 | 542 | 534 | 513 | 528 | 571 | 550 | 548 | 579 | 593 | 566 | 577 | 568 |
| 1994 | 544 | 530 | 599 | 619 | 623 | 586 | 589 | 589 | 615 | 559 | 552 | 573 |
| 1995 | 583 | 554 | 548 | 606 | 593 | 619 | 614 | 610 | 565 | 600 | 588 | 593 |
| 1996 | 566 | 527 | 516 | 621 | 602 | 616 | 636 | 633 | 602 | 603 | 605 | 627 |
| 1997 | 574 | 566 | 573 | 626 | 636 | 655 | 621 | 638 | 633 | 625 | 619 | 598 |
| 1998 | 596 | 565 | 600 | 615 | 662 | 638 | 651 | 650 | 628 | 605 | 573 | 601 |
| 1999 | 574 | 566 | 551 | 617 | 622 | 596 | 582 | 600 | 605 | 552 | 609 | 596 |
| 2000 | 566 | 592 | 560 | 629 | 632 | 645 | 610 | 624 | 604 | 576 | 626 | 616 |
| 2001 | 593 | 567 | 581 | 598 | 621 | 627 | 566 | 613 | 634 | 645 | 602 | 614 |
| 2002 | 563 | 506 | 559 | 614 | 627 | 618 | 611 | 581 | 579 | 607 | 615 | 593 |
| 2003 | 539 | 591 | 635 | 634 | 649 | 599 | 583 | 647 | 607 | 583 | 598 | 607 |
| 2004 | 562 | 599 | 633 | 642 | 664 | 653 | 661 | 616 | 657 | 606 | 600 | 588 |
| 2005 | 551 | 543 | 576 | 553 | 589 | 639 | 639 | 620 | 617 | 602 | 578 | 579 |
| 2006 | 547 | 597 | 574 | 698 | 786 | 799 | 776 | 795 | 791 | 748 | 731 | 743 |
| 2007 | 709 | 681 | 650 | 693 | 685 | 697 | 768 | 789 | 794 | 746 | 714 | 754 |
| 2008 | 725 | 725 | 727 | 796 | 765 | 769 | 774 | 779 | 768 | 751 | 727 | 705 |
| 2009 | 708 | 739 | 728 | 756 | 674 | 794 | 810 | 810 | 759 | 767 | 843 | 810 |
| 2010 | 778 | 792 | 833 | 928 | 927 | 842 | 857 | 928 | 909 | 875 | 884 | 872 |
| 2011 | 796 | 767 | 896 | 924 | 924 | 926 | 892 | 949 | 926 | 901 | 932 | 877 |
| 2012 | 901 | 885 | 921 | 905 | 916 | 949 | 932 | 911 | 924 | 863 | 844 | 895 |
| 2013 | 902 | 895 | 951 | 961 | 1,019 | 1,058 | 1,016 | 1,046 | 1,008 | 951 | 966 | 961 |
| 2014 | 946 | 929 | 954 | 1,022 | 974 | 958 | 933 | 998 | 955 | 948 | 958 | 947 |
| 2015 | 918 | 895 | 946 | 968 | 979 | 998 | 973 | 1,030 | 1,015 | 967 | 978 | 961 |
| 2016 | 935 | 973 | 1,014 | 999 | 1,018 | 1,016 | 1,036 | 1,016 | 1,021 | 998 | 967 | 956 |
| 2017 | 932 | 929 | 988 | 1,033 | 1,034 | 1,040 | 1,029 | 996 | 1,007 | 966 | 929 | 985 |
| 2018 | 940 | 903 | 943 | 992 | 1,041 | 1,054 | 1,016 | 1,046 | 990 | 1,000 | 980 | 968 |
| 2019 | 922 | 958 | 961 | 995 | 1,030 | 1,030 | 1,019 | 1,022 | 1,036 | 1,002 | 1,020 | 1,012 |
| 2020 | 888 | 922 | 883 | 718 | 810 | 905 | 933 | 967 | 956 | 915 | 914 | 880 |
| 2021 | 887 | 742 | 954 | 1,023 | 1,016 | 993 | 1,018 | 1,016 | 1,030 | 1,026 | 1,008 | 994 |
| 2022 | 912 | 929 | 977 | 1,003 | 1,047 | 1,023 | 984 | 1,002 | 1,031 | 998 | 991 | 945 |
| 2023 | 906 | 941 | 1,005 | 1,009 | 997 | 997 | 1,041 | 1,042 | 1,020 | 943 | 936 | 950 |
| 2024 | 928 | 1,006 | 1,030 | 1,033 | ||||||||
| - = No Data Reported; -- = Not Applicable; NA = Not Available; W = Withheld to avoid disclosure of individual company data. |
| Release Date: 6/28/2024 |
| Next Release Date: 7/31/2024 |