|
Download Data (XLS File) |
|
||||||||
|
||||||||
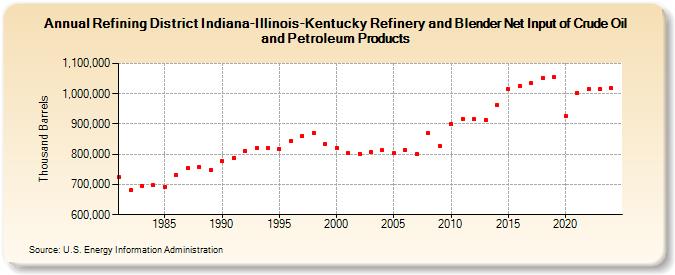
| Refining District Indiana-Illinois-Kentucky Refinery and Blender Net Input of Crude Oil and Petroleum Products (Thousand Barrels) | ||||||||
| Decade | Year-0 | Year-1 | Year-2 | Year-3 | Year-4 | Year-5 | Year-6 | Year-7 | Year-8 | Year-9 |
|---|---|---|---|---|---|---|---|---|---|---|
| 1980's | 723,139 | 681,625 | 696,161 | 696,743 | 692,850 | 731,189 | 753,780 | 757,956 | 748,843 | |
| 1990's | 776,892 | 788,321 | 810,396 | 821,369 | 819,723 | 816,772 | 844,606 | 861,143 | 870,891 | 832,995 |
| 2000's | 820,669 | 803,292 | 802,313 | 807,303 | 812,463 | 802,934 | 814,252 | 800,300 | 868,915 | 827,366 |
| 2010's | 899,317 | 917,649 | 915,259 | 913,736 | 961,912 | 1,014,859 | 1,024,831 | 1,035,878 | 1,052,036 | 1,054,136 |
| 2020's | 925,062 | 1,003,479 | 1,016,004 | 1,016,121 |
| - = No Data Reported; -- = Not Applicable; NA = Not Available; W = Withheld to avoid disclosure of individual company data. |
| Release Date: 3/29/2024 |
| Next Release Date: 8/30/2024 |