|
Download Data (XLS File) |
|
||||||||
|
||||||||
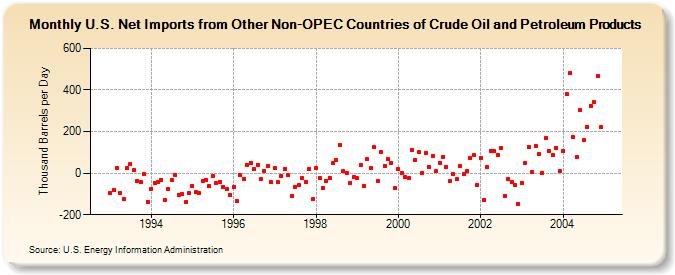
| U.S. Net Imports from Other Non-OPEC Countries of Crude Oil and Petroleum Products (Thousand Barrels per Day) | ||||||||
| Year | Jan | Feb | Mar | Apr | May | Jun | Jul | Aug | Sep | Oct | Nov | Dec |
|---|---|---|---|---|---|---|---|---|---|---|---|---|
| 1993 | -94 | -81 | 26 | -95 | -124 | 25 | 43 | 14 | -36 | -43 | -6 | -137 |
| 1994 | -74 | -48 | -44 | -31 | -129 | -76 | -33 | -7 | -104 | -98 | -141 | -96 |
| 1995 | -61 | -91 | -96 | -38 | -32 | -63 | -14 | -49 | -42 | -68 | -75 | -103 |
| 1996 | -66 | -136 | -11 | -26 | 40 | 51 | 21 | 41 | -29 | 10 | 35 | -45 |
| 1997 | 23 | -45 | -14 | 21 | -11 | -108 | -66 | -59 | -24 | -43 | 19 | -126 |
| 1998 | 27 | -22 | -72 | -36 | -22 | 47 | 61 | 137 | 9 | 1 | -46 | -18 |
| 1999 | -25 | 40 | -62 | 67 | 23 | 124 | -40 | 102 | 36 | 69 | 50 | -70 |
| 2000 | 20 | 0 | -19 | -25 | 113 | 62 | 100 | 1 | 99 | 30 | 83 | 9 |
| 2001 | 49 | 80 | 30 | -38 | -4 | -30 | 33 | -6 | 10 | 73 | 85 | -56 |
| 2002 | 74 | -127 | 29 | 107 | 105 | 88 | 123 | -110 | -28 | -42 | -58 | -147 |
| 2003 | -46 | 51 | 126 | 4 | 131 | 93 | 2 | 170 | 107 | 88 | 122 | 9 |
| 2004 | 107 | 379 | 483 | 172 | 76 | 302 | 158 | 222 | 323 | 340 | 465 | 220 |
| - = No Data Reported; -- = Not Applicable; NA = Not Available; W = Withheld to avoid disclosure of individual company data. |
| Release Date: 6/28/2024 |
| Next Release Date: 7/31/2024 |