|
Download Data (XLS File) |
|
||||||||
|
||||||||
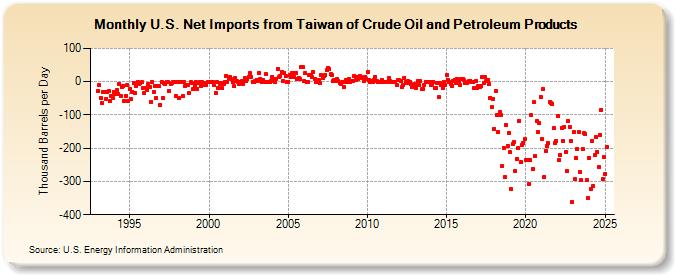
| U.S. Net Imports from Taiwan of Crude Oil and Petroleum Products (Thousand Barrels per Day) | ||||||||
| Year | Jan | Feb | Mar | Apr | May | Jun | Jul | Aug | Sep | Oct | Nov | Dec |
|---|---|---|---|---|---|---|---|---|---|---|---|---|
| 1993 | -28 | -10 | -49 | -64 | -32 | -30 | -51 | -30 | -29 | -58 | -42 | -48 |
| 1994 | -30 | -36 | -26 | -36 | -8 | -42 | -17 | -13 | -58 | -42 | -9 | -58 |
| 1995 | -22 | -53 | -30 | -4 | -34 | -12 | 0 | -6 | -5 | -2 | -18 | -35 |
| 1996 | -20 | -26 | -7 | -15 | -60 | -1 | -30 | -12 | -48 | -13 | -14 | -70 |
| 1997 | -1 | -49 | -5 | -6 | -1 | -1 | -27 | -6 | -3 | -1 | -1 | -43 |
| 1998 | -1 | -48 | -1 | -1 | -44 | -1 | -13 | -9 | -10 | -34 | -2 | -3 |
| 1999 | -23 | -13 | -1 | -21 | -5 | -1 | -13 | -2 | -3 | -11 | -11 | -1 |
| 2000 | -1 | -1 | -2 | -1 | -10 | -33 | -1 | -19 | -7 | -4 | -20 | -6 |
| 2001 | 0 | 18 | 0 | 11 | 15 | 7 | 0 | -14 | 12 | 1 | -1 | -6 |
| 2002 | 0 | 1 | -6 | 10 | 1 | 8 | 14 | 25 | 15 | 0 | 0 | 1 |
| 2003 | 6 | 2 | 27 | 9 | -1 | 4 | -2 | 23 | 0 | -1 | -1 | 2 |
| 2004 | 15 | 7 | -2 | 8 | 39 | 13 | 18 | 30 | 3 | 27 | 16 | -2 |
| 2005 | 0 | 19 | 13 | 27 | 13 | 25 | 26 | 9 | 12 | 7 | 45 | 43 |
| 2006 | 1 | 26 | 0 | 0 | 21 | 21 | 14 | 29 | 9 | -1 | 0 | 6 |
| 2007 | -4 | 19 | 11 | 16 | 19 | 34 | 42 | 39 | 22 | 19 | 2 | 4 |
| 2008 | 2 | 9 | 2 | -4 | -7 | -2 | -17 | -1 | 6 | 0 | 7 | 0 |
| 2009 | 2 | 3 | 17 | 6 | 13 | 9 | 17 | 14 | 12 | 3 | 14 | 8 |
| 2010 | 29 | 5 | 0 | 2 | -1 | 5 | 14 | 2 | -1 | 0 | 0 | 4 |
| 2011 | 0 | -1 | -1 | 0 | 10 | 1 | 0 | 0 | 0 | -1 | -10 | 4 |
| 2012 | 5 | 2 | -17 | -9 | 12 | -1 | -5 | 1 | 0 | -8 | -16 | -10 |
| 2013 | -8 | -19 | 2 | -10 | 2 | -23 | -21 | -11 | 0 | -1 | 0 | 0 |
| 2014 | -11 | -6 | 0 | -19 | -19 | -5 | -47 | -3 | -11 | -20 | 0 | -10 |
| 2015 | 20 | 6 | 0 | -8 | -12 | 3 | 5 | -4 | 8 | 2 | -10 | 9 |
| 2016 | 9 | 4 | -4 | -4 | -1 | 1 | 3 | 0 | -1 | -19 | 2 | -18 |
| 2017 | -13 | -16 | -12 | 13 | -3 | 13 | 1 | 6 | -7 | -48 | -77 | -52 |
| 2018 | -141 | -28 | -100 | -152 | -92 | -101 | -254 | -200 | -286 | -130 | -193 | -153 |
| 2019 | -212 | -324 | -186 | -182 | -268 | -233 | -198 | -117 | -243 | -190 | -185 | -173 |
| 2020 | -236 | -235 | -307 | -237 | -101 | -263 | -62 | -224 | -119 | -151 | -124 | -46 |
| 2021 | -171 | -23 | -286 | -208 | -193 | -184 | -61 | -64 | -66 | -140 | -183 | -178 |
| 2022 | -104 | -235 | -220 | -139 | -177 | -135 | -211 | -270 | -119 | -135 | -177 | -362 |
| 2023 | -175 | -197 | -230 | -202 | -150 | -365 | -206 | -202 | -147 | -165 | -324 | -323 |
| 2024 | -230 | |||||||||||
| - = No Data Reported; -- = Not Applicable; NA = Not Available; W = Withheld to avoid disclosure of individual company data. |
| Release Date: 3/29/2024 |
| Next Release Date: 4/30/2024 |