|
Download Data (XLS File) |
|
||||||||
|
||||||||
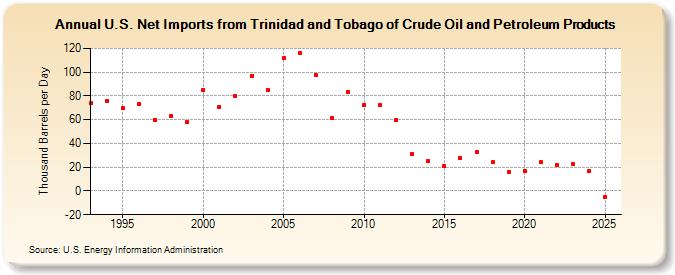
| U.S. Net Imports from Trinidad and Tobago of Crude Oil and Petroleum Products (Thousand Barrels per Day) | ||||||||
| Decade | Year-0 | Year-1 | Year-2 | Year-3 | Year-4 | Year-5 | Year-6 | Year-7 | Year-8 | Year-9 |
|---|---|---|---|---|---|---|---|---|---|---|
| 1990's | 74 | 76 | 70 | 73 | 60 | 63 | 58 | |||
| 2000's | 85 | 71 | 80 | 97 | 85 | 112 | 116 | 98 | 61 | 83 |
| 2010's | 72 | 72 | 60 | 31 | 25 | 21 | 28 | 33 | 24 | 16 |
| 2020's | 17 | 24 | 22 | 23 |
| - = No Data Reported; -- = Not Applicable; NA = Not Available; W = Withheld to avoid disclosure of individual company data. |
| Release Date: 3/29/2024 |
| Next Release Date: 8/30/2024 |