|
Download Data (XLS File) |
|
||||||||
|
||||||||
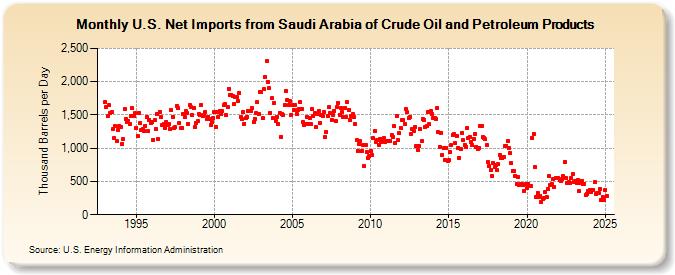
| U.S. Net Imports from Saudi Arabia of Crude Oil and Petroleum Products (Thousand Barrels per Day) | ||||||||
| Year | Jan | Feb | Mar | Apr | May | Jun | Jul | Aug | Sep | Oct | Nov | Dec |
|---|---|---|---|---|---|---|---|---|---|---|---|---|
| 1993 | 1,687 | 1,625 | 1,479 | 1,644 | 1,523 | 1,540 | 1,283 | 1,151 | 1,328 | 1,115 | 1,280 | 1,330 |
| 1994 | 1,319 | 1,070 | 1,132 | 1,586 | 1,437 | 1,395 | 1,414 | 1,363 | 1,486 | 1,600 | 1,477 | 1,524 |
| 1995 | 1,309 | 1,181 | 1,535 | 1,375 | 1,280 | 1,286 | 1,265 | 1,340 | 1,474 | 1,259 | 1,429 | 1,377 |
| 1996 | 1,398 | 1,128 | 1,419 | 1,287 | 1,518 | 1,138 | 1,548 | 1,476 | 1,353 | 1,357 | 1,297 | 1,400 |
| 1997 | 1,343 | 1,361 | 1,292 | 1,573 | 1,474 | 1,299 | 1,312 | 1,635 | 1,599 | 1,377 | 1,307 | 1,309 |
| 1998 | 1,515 | 1,469 | 1,552 | 1,527 | 1,362 | 1,645 | 1,615 | 1,498 | 1,606 | 1,316 | 1,386 | 1,402 |
| 1999 | 1,510 | 1,497 | 1,652 | 1,482 | 1,500 | 1,538 | 1,436 | 1,474 | 1,441 | 1,352 | 1,396 | 1,455 |
| 2000 | 1,543 | 1,317 | 1,546 | 1,466 | 1,566 | 1,512 | 1,554 | 1,649 | 1,667 | 1,498 | 1,616 | 1,897 |
| 2001 | 1,803 | 1,800 | 1,786 | 1,658 | 1,770 | 1,764 | 1,711 | 1,835 | 1,476 | 1,432 | 1,542 | 1,369 |
| 2002 | 1,452 | 1,473 | 1,558 | 1,553 | 1,563 | 1,597 | 1,392 | 1,444 | 1,529 | 1,690 | 1,511 | 1,843 |
| 2003 | 1,839 | 1,447 | 1,886 | 2,069 | 2,305 | 2,000 | 1,900 | 1,535 | 1,747 | 1,450 | 1,680 | 1,410 |
| 2004 | 1,476 | 1,369 | 1,531 | 1,175 | 1,517 | 1,498 | 1,654 | 1,862 | 1,731 | 1,646 | 1,705 | 1,501 |
| 2005 | 1,653 | 1,572 | 1,649 | 1,514 | 1,580 | 1,595 | 1,692 | 1,589 | 1,389 | 1,349 | 1,368 | 1,471 |
| 2006 | 1,368 | 1,451 | 1,358 | 1,592 | 1,491 | 1,526 | 1,313 | 1,513 | 1,564 | 1,382 | 1,506 | 1,491 |
| 2007 | 1,541 | 1,163 | 1,244 | 1,487 | 1,613 | 1,531 | 1,429 | 1,498 | 1,559 | 1,408 | 1,616 | 1,685 |
| 2008 | 1,502 | 1,605 | 1,542 | 1,462 | 1,604 | 1,464 | 1,690 | 1,573 | 1,431 | 1,487 | 1,514 | 1,468 |
| 2009 | 1,362 | 1,117 | 964 | 1,056 | 1,101 | 956 | 1,043 | 727 | 1,044 | 942 | 854 | 877 |
| 2010 | 963 | 898 | 1,148 | 1,257 | 1,096 | 1,124 | 1,053 | 1,131 | 1,093 | 1,131 | 1,152 | 1,093 |
| 2011 | 1,101 | 1,114 | 1,105 | 1,106 | 1,192 | 1,168 | 1,326 | 1,075 | 1,478 | 1,117 | 1,222 | 1,309 |
| 2012 | 1,422 | 1,420 | 1,368 | 1,592 | 1,540 | 1,453 | 1,465 | 1,220 | 1,291 | 1,258 | 1,315 | 1,030 |
| 2013 | 978 | 1,031 | 1,282 | 1,104 | 1,438 | 1,429 | 1,317 | 1,331 | 1,543 | 1,360 | 1,562 | 1,519 |
| 2014 | 1,456 | 1,453 | 1,443 | 1,606 | 1,239 | 1,016 | 1,231 | 896 | 996 | 829 | 1,008 | 811 |
| 2015 | 816 | 940 | 1,041 | 1,204 | 1,209 | 1,077 | 1,186 | 1,005 | 857 | 983 | 1,232 | 1,116 |
| 2016 | 1,052 | 1,022 | 1,308 | 1,153 | 1,171 | 1,095 | 1,050 | 1,142 | 1,210 | 1,022 | 986 | 1,010 |
| 2017 | 1,339 | 1,338 | 1,168 | 1,160 | 1,132 | 1,045 | 792 | 735 | 671 | 589 | 777 | 716 |
| 2018 | 742 | 667 | 757 | 904 | 848 | 847 | 872 | 1,035 | 1,040 | 1,106 | 999 | 928 |
| 2019 | 773 | 663 | 664 | 582 | 461 | 570 | 451 | 460 | 457 | 440 | 355 | 468 |
| 2020 | 407 | 469 | 439 | 427 | 1,152 | 1,219 | 718 | 268 | 330 | 266 | 284 | 190 |
| 2021 | 235 | 255 | 345 | 271 | 389 | 577 | 451 | 469 | 536 | 413 | 553 | 549 |
| 2022 | 551 | 517 | 513 | 534 | 577 | 799 | 550 | 481 | 499 | 478 | 550 | 605 |
| 2023 | 495 | 512 | 480 | 525 | 350 | 484 | 512 | 457 | 469 | 293 | 318 | 351 |
| 2024 | 372 | |||||||||||
| - = No Data Reported; -- = Not Applicable; NA = Not Available; W = Withheld to avoid disclosure of individual company data. |
| Release Date: 3/29/2024 |
| Next Release Date: 4/30/2024 |