|
Download Data (XLS File) |
|
||||||||
|
||||||||
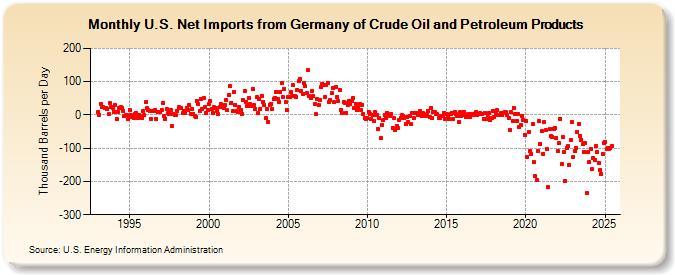
| U.S. Net Imports from Germany of Crude Oil and Petroleum Products (Thousand Barrels per Day) | ||||||||
| Year | Jan | Feb | Mar | Apr | May | Jun | Jul | Aug | Sep | Oct | Nov | Dec |
|---|---|---|---|---|---|---|---|---|---|---|---|---|
| 1993 | 10 | 0 | 34 | 25 | 23 | 21 | 22 | 18 | 2 | 35 | 25 | 22 |
| 1994 | 10 | 30 | -12 | 10 | 21 | 23 | 21 | 11 | -3 | 0 | -1 | -11 |
| 1995 | 15 | -1 | -5 | -9 | 2 | 6 | -9 | 0 | -4 | -10 | 11 | -1 |
| 1996 | 39 | 20 | 15 | 13 | -11 | 13 | 12 | 14 | -11 | 8 | 8 | 10 |
| 1997 | 15 | 36 | -2 | -11 | 18 | 5 | 3 | 15 | -32 | 4 | 0 | -1 |
| 1998 | 13 | 23 | 22 | 22 | 5 | 11 | 7 | 22 | 16 | 30 | 3 | 19 |
| 1999 | 4 | -2 | -5 | 42 | 32 | 12 | 49 | 19 | 51 | 24 | 5 | 14 |
| 2000 | 33 | 42 | 18 | 6 | 23 | 21 | 13 | 3 | 23 | 32 | 24 | 22 |
| 2001 | 29 | 46 | 14 | 60 | 86 | 36 | 11 | 68 | 30 | 12 | 8 | 24 |
| 2002 | 15 | 3 | 45 | 73 | 40 | 26 | 50 | 33 | 27 | 79 | 29 | 19 |
| 2003 | 53 | 5 | 48 | 19 | 58 | 40 | 29 | -10 | 19 | -20 | 31 | 34 |
| 2004 | 17 | 49 | 52 | 69 | 48 | 39 | 69 | 95 | 53 | 78 | 39 | 15 |
| 2005 | 55 | 53 | 68 | 58 | 89 | 58 | 54 | 76 | 101 | 108 | 73 | 64 |
| 2006 | 96 | 86 | 66 | 134 | 57 | 52 | 72 | 57 | 34 | 2 | 48 | 29 |
| 2007 | 46 | 85 | 94 | 91 | 55 | 91 | 96 | 40 | 45 | 66 | 82 | 38 |
| 2008 | 84 | 55 | 42 | 76 | 16 | 5 | 40 | 37 | 7 | 30 | 41 | 34 |
| 2009 | 42 | 50 | 21 | 33 | 15 | 23 | 32 | 16 | 30 | 3 | -9 | -12 |
| 2010 | -10 | 10 | 4 | -12 | 1 | -19 | 8 | 0 | -41 | -9 | -69 | -31 |
| 2011 | -15 | -1 | -9 | 7 | 1 | -2 | 4 | -39 | -10 | -44 | -32 | -39 |
| 2012 | -14 | -9 | -1 | -3 | -8 | -26 | -7 | -20 | -4 | -28 | 5 | -9 |
| 2013 | 5 | 6 | 0 | 3 | 12 | -4 | 5 | -3 | -3 | 4 | 12 | -5 |
| 2014 | 22 | -10 | 8 | 8 | 3 | 2 | -10 | -10 | -4 | -4 | 7 | -12 |
| 2015 | 2 | -3 | -11 | 4 | 7 | -12 | 8 | 4 | -4 | -22 | 8 | -2 |
| 2016 | 0 | 9 | 2 | -7 | -3 | 3 | -5 | 2 | 4 | 0 | 8 | -1 |
| 2017 | 3 | 5 | 2 | 4 | -11 | 5 | -13 | -7 | 6 | -14 | -9 | 13 |
| 2018 | -6 | 2 | 14 | 1 | 1 | 5 | 1 | 6 | 9 | 8 | -1 | -10 |
| 2019 | -44 | 8 | -18 | 22 | 4 | -17 | 3 | -36 | -31 | -4 | -15 | -59 |
| 2020 | -17 | -126 | -51 | -109 | -116 | -26 | -143 | -185 | -197 | -108 | -19 | -86 |
| 2021 | -49 | -116 | -21 | -46 | -103 | -217 | -43 | -64 | -66 | -41 | -39 | -70 |
| 2022 | -108 | -85 | -12 | -147 | -67 | -110 | -199 | -100 | -94 | -150 | -76 | -22 |
| 2023 | -108 | -107 | -106 | -52 | -27 | -62 | -79 | -88 | -117 | -84 | -200 | -131 |
| 2024 | -141 | |||||||||||
| - = No Data Reported; -- = Not Applicable; NA = Not Available; W = Withheld to avoid disclosure of individual company data. |
| Release Date: 3/29/2024 |
| Next Release Date: 4/30/2024 |