|
Download Data (XLS File) |
|
||||||||
|
||||||||
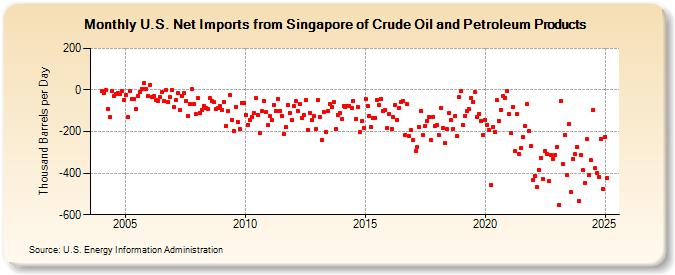
| U.S. Net Imports from Singapore of Crude Oil and Petroleum Products (Thousand Barrels per Day) | ||||||||
| Year | Jan | Feb | Mar | Apr | May | Jun | Jul | Aug | Sep | Oct | Nov | Dec |
|---|---|---|---|---|---|---|---|---|---|---|---|---|
| 2004 | -6 | -14 | -2 | -91 | -132 | -4 | -28 | -20 | -16 | -18 | -5 | -48 |
| 2005 | -24 | -131 | -5 | -44 | -43 | -90 | -27 | -10 | 6 | 33 | 7 | -28 |
| 2006 | 26 | -35 | -31 | -49 | -51 | -33 | -11 | -55 | 0 | -56 | -35 | 0 |
| 2007 | -83 | -48 | -15 | -94 | -27 | -14 | -51 | -123 | -67 | 3 | -69 | -116 |
| 2008 | -40 | -109 | -94 | -75 | -88 | -92 | -40 | -55 | -60 | -92 | -88 | -76 |
| 2009 | -94 | -56 | -174 | -101 | -25 | -144 | -195 | -80 | -154 | -189 | -62 | -62 |
| 2010 | -119 | -167 | -145 | -130 | -110 | -38 | -118 | -208 | -103 | -52 | -106 | -170 |
| 2011 | -126 | -143 | -72 | -99 | -44 | -101 | -124 | -212 | -176 | -72 | -110 | -144 |
| 2012 | -76 | -52 | -99 | -68 | -135 | -118 | -49 | -193 | -109 | -143 | -127 | -188 |
| 2013 | -49 | -128 | -239 | -106 | -203 | -102 | -66 | -84 | -58 | -187 | -120 | -113 |
| 2014 | -142 | -77 | -81 | -76 | -76 | -88 | -52 | -139 | -81 | -204 | -150 | -182 |
| 2015 | -44 | -75 | -124 | -177 | -136 | -133 | -47 | -73 | -42 | -100 | -96 | -185 |
| 2016 | -116 | -186 | -132 | -72 | -145 | -85 | -59 | -52 | -215 | -68 | -222 | -192 |
| 2017 | -243 | -294 | -274 | -177 | -99 | -217 | -172 | -147 | -129 | -243 | -130 | -171 |
| 2018 | -169 | -218 | -85 | -184 | -255 | -190 | -111 | -145 | -187 | -126 | -222 | -35 |
| 2019 | -4 | -169 | -125 | -100 | -93 | -37 | -56 | -11 | -132 | -114 | -151 | -215 |
| 2020 | -143 | -168 | -192 | -458 | -178 | -200 | -50 | -150 | -97 | -31 | -38 | -4 |
| 2021 | -116 | -207 | -80 | -295 | -116 | -309 | -278 | -227 | -175 | -68 | -199 | -270 |
| 2022 | -431 | -416 | -468 | -386 | -326 | -426 | -295 | -308 | -440 | -314 | -333 | -312 |
| 2023 | -309 | -502 | -55 | -375 | -228 | -337 | -194 | -388 | -325 | -304 | -305 | -513 |
| 2024 | -311 | |||||||||||
| - = No Data Reported; -- = Not Applicable; NA = Not Available; W = Withheld to avoid disclosure of individual company data. |
| Release Date: 3/29/2024 |
| Next Release Date: 4/30/2024 |