|
Download Data (XLS File) |
|
||||||||
|
||||||||
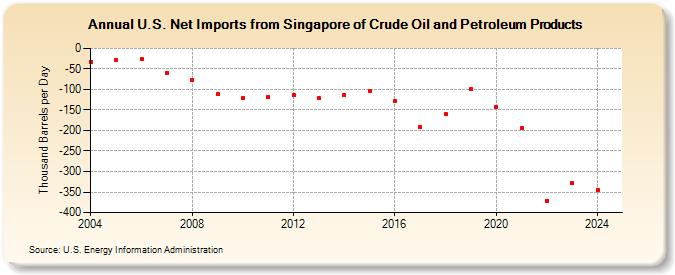
| U.S. Net Imports from Singapore of Crude Oil and Petroleum Products (Thousand Barrels per Day) | ||||||||
| Decade | Year-0 | Year-1 | Year-2 | Year-3 | Year-4 | Year-5 | Year-6 | Year-7 | Year-8 | Year-9 |
|---|---|---|---|---|---|---|---|---|---|---|
| 2000's | -32 | -29 | -27 | -59 | -76 | -112 | ||||
| 2010's | -122 | -118 | -114 | -122 | -113 | -103 | -128 | -191 | -160 | -100 |
| 2020's | -142 | -194 | -371 | -318 |
| - = No Data Reported; -- = Not Applicable; NA = Not Available; W = Withheld to avoid disclosure of individual company data. |
| Release Date: 3/29/2024 |
| Next Release Date: 8/30/2024 |