|
Download Data (XLS File) |
|
||||||||
|
||||||||
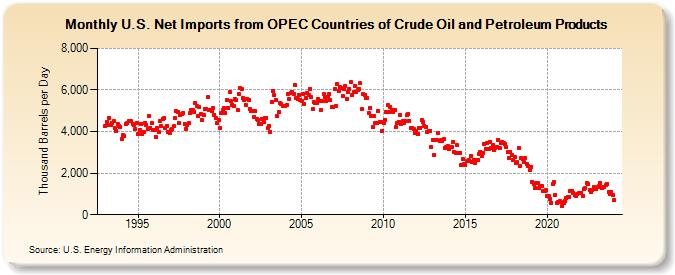
| U.S. Net Imports from OPEC Countries of Crude Oil and Petroleum Products (Thousand Barrels per Day) | ||||||||
| Year | Jan | Feb | Mar | Apr | May | Jun | Jul | Aug | Sep | Oct | Nov | Dec |
|---|---|---|---|---|---|---|---|---|---|---|---|---|
| 1993 | 4,267 | 4,483 | 4,301 | 4,652 | 4,329 | 4,412 | 4,489 | 4,150 | 4,043 | 4,354 | 4,257 | 4,223 |
| 1994 | 3,618 | 3,825 | 3,785 | 4,386 | 4,389 | 4,505 | 4,498 | 4,495 | 4,375 | 4,298 | 4,146 | 4,422 |
| 1995 | 3,890 | 4,096 | 4,367 | 3,876 | 3,996 | 4,425 | 4,327 | 4,130 | 4,748 | 4,179 | 4,409 | 4,074 |
| 1996 | 4,086 | 3,715 | 4,147 | 3,974 | 4,525 | 4,245 | 4,606 | 4,637 | 4,193 | 4,267 | 3,960 | 3,919 |
| 1997 | 4,069 | 4,116 | 4,249 | 4,659 | 4,973 | 4,962 | 4,411 | 4,805 | 4,840 | 4,881 | 4,378 | 4,141 |
| 1998 | 4,334 | 4,400 | 4,898 | 5,050 | 5,040 | 4,935 | 5,373 | 5,227 | 4,733 | 5,157 | 4,822 | 4,543 |
| 1999 | 4,794 | 5,091 | 5,088 | 5,652 | 5,057 | 5,021 | 4,998 | 5,119 | 4,820 | 4,633 | 4,422 | 4,539 |
| 2000 | 4,160 | 4,879 | 5,035 | 5,139 | 4,889 | 5,538 | 5,155 | 5,879 | 5,451 | 5,293 | 5,213 | 5,546 |
| 2001 | 5,506 | 5,058 | 5,808 | 6,086 | 6,057 | 5,610 | 5,494 | 5,260 | 5,578 | 5,530 | 5,081 | 5,010 |
| 2002 | 5,007 | 4,723 | 4,977 | 4,588 | 4,551 | 4,346 | 4,351 | 4,615 | 4,437 | 4,663 | 4,662 | 4,147 |
| 2003 | 4,273 | 3,994 | 5,417 | 5,935 | 5,745 | 5,517 | 4,727 | 4,921 | 5,360 | 5,331 | 5,227 | 5,215 |
| 2004 | 5,239 | 5,274 | 5,815 | 5,570 | 5,871 | 5,913 | 5,830 | 6,242 | 5,603 | 5,573 | 5,778 | 5,528 |
| 2005 | 5,464 | 5,830 | 5,346 | 5,606 | 5,865 | 5,765 | 6,068 | 5,641 | 5,072 | 5,398 | 5,366 | 5,396 |
| 2006 | 5,571 | 5,480 | 5,052 | 5,446 | 5,794 | 5,640 | 5,463 | 5,676 | 5,798 | 5,505 | 5,158 | 5,184 |
| 2007 | 6,055 | 5,249 | 6,280 | 5,934 | 6,150 | 6,092 | 5,720 | 6,061 | 6,202 | 5,582 | 5,906 | 6,067 |
| 2008 | 6,371 | 5,763 | 5,881 | 6,215 | 5,898 | 5,982 | 6,066 | 6,314 | 5,089 | 5,811 | 5,755 | 5,622 |
| 2009 | 5,625 | 4,904 | 5,140 | 4,740 | 4,217 | 4,745 | 4,426 | 4,389 | 4,979 | 4,471 | 4,461 | 4,039 |
| 2010 | 4,425 | 4,573 | 4,950 | 5,264 | 4,938 | 5,192 | 5,052 | 4,951 | 5,018 | 4,203 | 4,404 | 4,480 |
| 2011 | 4,775 | 4,378 | 4,507 | 4,409 | 4,510 | 4,788 | 4,837 | 4,526 | 4,179 | 4,192 | 4,101 | 3,933 |
| 2012 | 4,049 | 3,890 | 4,165 | 4,193 | 4,549 | 4,477 | 4,268 | 4,227 | 3,991 | 4,031 | 4,038 | 3,237 |
| 2013 | 3,597 | 2,876 | 3,584 | 3,579 | 3,945 | 3,564 | 3,570 | 3,569 | 3,638 | 3,232 | 3,280 | 3,311 |
| 2014 | 3,146 | 3,272 | 3,254 | 3,509 | 2,993 | 2,969 | 3,331 | 2,966 | 2,990 | 2,413 | 2,684 | 2,452 |
| 2015 | 2,373 | 2,577 | 2,564 | 2,612 | 2,839 | 2,547 | 2,638 | 2,498 | 2,617 | 2,645 | 2,897 | 3,032 |
| 2016 | 2,824 | 2,966 | 3,394 | 3,167 | 3,439 | 3,152 | 3,521 | 3,216 | 3,359 | 3,109 | 3,208 | 3,275 |
| 2017 | 3,612 | 3,189 | 3,434 | 3,506 | 3,464 | 3,404 | 3,236 | 2,999 | 2,721 | 3,007 | 2,870 | 2,641 |
| 2018 | 2,787 | 2,500 | 2,518 | 3,217 | 2,361 | 2,719 | 2,656 | 2,538 | 2,708 | 2,462 | 2,367 | 2,142 |
| 2019 | 2,308 | 1,592 | 1,471 | 1,308 | 1,502 | 1,521 | 1,262 | 1,390 | 1,385 | 1,129 | 1,149 | 1,200 |
| 2020 | 882 | 893 | 757 | 585 | 1,469 | 1,570 | 957 | 544 | 596 | 639 | 613 | 433 |
| 2021 | 561 | 646 | 790 | 854 | 875 | 1,146 | 1,125 | 1,044 | 964 | 919 | 1,003 | 1,030 |
| 2022 | 1,049 | 1,068 | 921 | 1,219 | 1,276 | 1,510 | 1,473 | 1,185 | 1,102 | 1,178 | 1,346 | 1,249 |
| 2023 | 1,214 | 1,341 | 1,359 | 1,534 | 1,269 | 1,354 | 1,340 | 1,416 | 1,473 | 1,085 | 980 | 1,077 |
| 2024 | 961 | |||||||||||
| - = No Data Reported; -- = Not Applicable; NA = Not Available; W = Withheld to avoid disclosure of individual company data. |
| Release Date: 3/29/2024 |
| Next Release Date: 4/30/2024 |