|
Download Data (XLS File) |
|
||||||||
|
||||||||
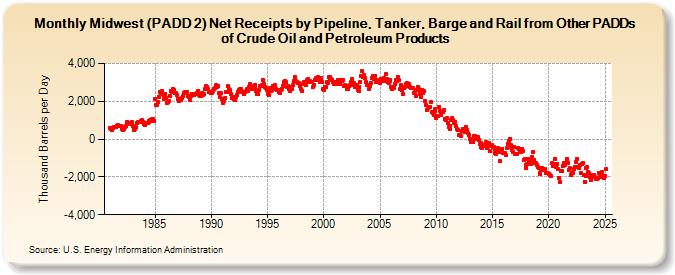
| Midwest (PADD 2) Net Receipts by Pipeline, Tanker, Barge and Rail from Other PADDs of Crude Oil and Petroleum Products (Thousand Barrels per Day) | ||||||||
| Year | Jan | Feb | Mar | Apr | May | Jun | Jul | Aug | Sep | Oct | Nov | Dec |
|---|---|---|---|---|---|---|---|---|---|---|---|---|
| 1981 | 604 | 510 | 500 | 585 | 643 | 666 | 647 | 708 | 758 | 717 | 669 | 709 |
| 1982 | 688 | 558 | 504 | 539 | 645 | 716 | 881 | 802 | 814 | 861 | 829 | 893 |
| 1983 | 711 | 469 | 479 | 524 | 624 | 871 | 889 | 887 | 889 | 950 | 1,005 | 889 |
| 1984 | 824 | 769 | 858 | 847 | 873 | 926 | 965 | 1,024 | 982 | 1,068 | 1,056 | 981 |
| 1985 | 2,110 | 1,793 | 1,796 | 1,959 | 2,248 | 2,491 | 2,456 | 2,522 | 2,389 | 2,141 | 2,232 | 2,408 |
| 1986 | 2,172 | 1,897 | 1,941 | 2,038 | 2,279 | 2,554 | 2,476 | 2,638 | 2,619 | 2,434 | 2,434 | 2,307 |
| 1987 | 2,122 | 2,022 | 2,083 | 2,106 | 2,092 | 2,200 | 2,266 | 2,454 | 2,478 | 2,434 | 2,476 | 2,302 |
| 1988 | 2,226 | 2,090 | 2,259 | 2,406 | 2,355 | 2,344 | 2,378 | 2,370 | 2,374 | 2,446 | 2,566 | 2,355 |
| 1989 | 2,268 | 2,295 | 2,432 | 2,331 | 2,408 | 2,625 | 2,789 | 2,753 | 2,645 | 2,477 | 2,472 | 2,487 |
| 1990 | 2,433 | 2,455 | 2,545 | 2,654 | 2,685 | 2,844 | 2,779 | 2,803 | 2,422 | 2,216 | 2,454 | 2,113 |
| 1991 | 1,932 | 2,030 | 2,134 | 2,172 | 2,508 | 2,497 | 2,784 | 2,631 | 2,582 | 2,384 | 2,187 | 2,223 |
| 1992 | 2,132 | 2,088 | 2,219 | 2,337 | 2,512 | 2,527 | 2,606 | 2,632 | 2,662 | 2,501 | 2,478 | 2,366 |
| 1993 | 2,475 | 2,525 | 2,631 | 2,558 | 2,748 | 2,894 | 2,818 | 2,664 | 2,703 | 2,760 | 2,877 | 2,742 |
| 1994 | 2,521 | 2,372 | 2,402 | 2,615 | 2,835 | 2,798 | 2,860 | 3,107 | 2,932 | 2,765 | 2,704 | 2,623 |
| 1995 | 2,407 | 2,334 | 2,583 | 2,682 | 2,533 | 2,595 | 2,816 | 2,749 | 2,841 | 2,639 | 2,617 | 2,576 |
| 1996 | 2,466 | 2,450 | 2,572 | 2,659 | 2,820 | 2,975 | 3,015 | 3,075 | 3,012 | 2,770 | 2,825 | 2,651 |
| 1997 | 2,533 | 2,749 | 2,651 | 2,850 | 3,047 | 3,260 | 3,098 | 3,033 | 2,970 | 2,955 | 2,816 | 2,819 |
| 1998 | 2,627 | 2,549 | 2,908 | 3,023 | 3,031 | 2,867 | 3,107 | 3,183 | 2,999 | 3,069 | 3,031 | 3,027 |
| 1999 | 2,744 | 2,869 | 2,844 | 3,150 | 3,238 | 3,245 | 3,275 | 3,108 | 3,015 | 3,209 | 3,021 | 2,666 |
| 2000 | 2,623 | 2,750 | 2,770 | 3,015 | 2,956 | 3,271 | 3,265 | 3,184 | 3,182 | 3,143 | 3,013 | 2,901 |
| 2001 | 2,998 | 2,928 | 2,991 | 3,132 | 3,140 | 2,935 | 3,143 | 3,055 | 3,115 | 2,814 | 2,837 | 2,830 |
| 2002 | 2,802 | 2,644 | 2,642 | 2,783 | 2,846 | 2,994 | 3,186 | 2,838 | 2,953 | 2,764 | 2,857 | 2,850 |
| 2003 | 2,575 | 2,561 | 2,762 | 3,012 | 3,352 | 3,582 | 3,286 | 3,397 | 3,232 | 2,998 | 2,880 | 2,856 |
| 2004 | 2,670 | 2,792 | 2,991 | 3,214 | 3,333 | 3,186 | 3,178 | 3,359 | 3,023 | 3,049 | 3,077 | 3,147 |
| 2005 | 2,985 | 3,173 | 3,057 | 3,162 | 3,208 | 3,056 | 3,429 | 3,187 | 3,033 | 2,970 | 3,089 | 3,102 |
| 2006 | 2,742 | 2,635 | 2,739 | 2,693 | 2,919 | 3,131 | 3,061 | 3,285 | 3,104 | 2,653 | 2,855 | 2,578 |
| 2007 | 2,366 | 2,684 | 2,760 | 2,780 | 2,940 | 2,959 | 2,786 | 2,906 | 2,756 | 2,708 | 2,721 | 2,705 |
| 2008 | 2,454 | 2,490 | 2,281 | 2,590 | 2,773 | 2,650 | 2,406 | 2,545 | 2,224 | 2,604 | 2,441 | 2,518 |
| 2009 | 1,989 | 1,808 | 1,528 | 1,668 | 1,710 | 1,721 | 1,949 | 1,423 | 1,399 | 1,256 | 1,591 | 1,462 |
| 2010 | 1,119 | 1,243 | 1,237 | 1,702 | 1,466 | 1,271 | 1,414 | 1,434 | 1,526 | 1,081 | 1,007 | 1,106 |
| 2011 | 843 | 616 | 534 | 691 | 1,019 | 1,123 | 1,035 | 867 | 912 | 714 | 541 | 455 |
| 2012 | 208 | 236 | 178 | 443 | 553 | 512 | 371 | 652 | 478 | 499 | 311 | 237 |
| 2013 | 19 | -159 | -12 | -166 | 187 | 184 | -9 | 3 | 137 | -49 | -244 | -416 |
| 2014 | -200 | -484 | -374 | -321 | -355 | -148 | -488 | -315 | -214 | -612 | -341 | -311 |
| 2015 | -432 | -441 | -536 | -727 | -805 | -645 | -496 | -673 | -1,176 | -650 | -501 | -741 |
| 2016 | -728 | -720 | -855 | -475 | -258 | -107 | 18 | -330 | -439 | -569 | -681 | -440 |
| 2017 | -811 | -770 | -787 | -446 | -547 | -637 | -659 | -510 | -649 | -1,085 | -1,077 | -1,392 |
| 2018 | -1,554 | -1,332 | -1,062 | -1,216 | -1,114 | -1,316 | -949 | -673 | -1,099 | -1,269 | -1,275 | -1,368 |
| 2019 | -1,481 | -1,533 | -1,851 | -1,802 | -1,628 | -1,554 | -1,654 | -1,604 | -1,608 | -1,789 | -1,790 | -1,794 |
| 2020 | -1,832 | -1,906 | -1,973 | -1,288 | -1,399 | -1,309 | -1,052 | -1,467 | -1,361 | -1,304 | -1,575 | -2,037 |
| 2021 | -2,253 | -1,691 | -1,700 | -1,414 | -1,255 | -1,357 | -1,270 | -1,061 | -1,256 | -1,622 | -1,543 | -1,877 |
| 2022 | -1,913 | -1,780 | -1,816 | -1,595 | -1,454 | -1,214 | -1,047 | -1,458 | -1,532 | -1,373 | -1,775 | -1,291 |
| 2023 | -1,270 | -1,916 | -2,188 | -1,939 | -1,550 | -1,478 | -1,759 | -1,799 | -2,058 | -2,177 | -1,874 | -1,903 |
| 2024 | -1,883 | |||||||||||
| - = No Data Reported; -- = Not Applicable; NA = Not Available; W = Withheld to avoid disclosure of individual company data. |
| Release Date: 3/29/2024 |
| Next Release Date: 4/30/2024 |