|
Download Data (XLS File) |
|
||||||||
|
||||||||
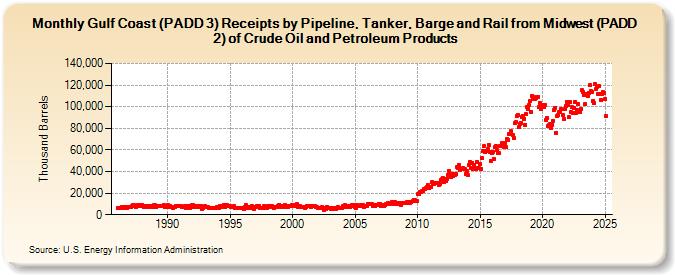
| Gulf Coast (PADD 3) Receipts by Pipeline, Tanker, Barge and Rail from Midwest (PADD 2) of Crude Oil and Petroleum Products (Thousand Barrels) | ||||||||
| Year | Jan | Feb | Mar | Apr | May | Jun | Jul | Aug | Sep | Oct | Nov | Dec |
|---|---|---|---|---|---|---|---|---|---|---|---|---|
| 1986 | 6,355 | 6,237 | 6,439 | 6,675 | 7,306 | 6,291 | 7,112 | 7,189 | 6,862 | 6,666 | 7,103 | 7,432 |
| 1987 | 7,558 | 6,890 | 8,159 | 8,689 | 8,788 | 8,232 | 7,474 | 9,157 | 8,285 | 8,543 | 7,819 | 9,299 |
| 1988 | 8,183 | 7,186 | 7,072 | 7,894 | 8,453 | 8,187 | 7,066 | 7,863 | 7,838 | 8,052 | 7,070 | 8,688 |
| 1989 | 8,757 | 7,126 | 7,772 | 8,482 | 8,135 | 7,985 | 8,014 | 7,772 | 8,974 | 7,268 | 7,734 | 7,051 |
| 1990 | 8,598 | 7,226 | 8,095 | 6,846 | 7,470 | 6,534 | 7,405 | 6,893 | 8,226 | 7,902 | 8,202 | 8,211 |
| 1991 | 8,393 | 7,932 | 7,182 | 6,970 | 7,417 | 7,966 | 6,489 | 8,186 | 7,040 | 6,550 | 8,012 | 8,620 |
| 1992 | 8,820 | 7,573 | 7,242 | 7,881 | 6,990 | 7,839 | 7,959 | 7,379 | 7,690 | 5,668 | 5,821 | 6,970 |
| 1993 | 8,052 | 6,705 | 7,217 | 6,778 | 6,463 | 6,639 | 6,322 | 5,966 | 6,075 | 6,390 | 6,027 | 7,020 |
| 1994 | 7,515 | 6,521 | 7,814 | 7,547 | 7,696 | 8,386 | 9,452 | 6,806 | 7,850 | 8,845 | 8,150 | 8,162 |
| 1995 | 7,954 | 6,969 | 7,152 | 7,245 | 7,625 | 6,591 | 6,043 | 6,376 | 6,039 | 6,553 | 6,382 | 6,633 |
| 1996 | 6,486 | 5,721 | 7,453 | 8,573 | 6,688 | 6,660 | 6,895 | 6,642 | 7,460 | 7,918 | 6,334 | 5,618 |
| 1997 | 7,054 | 7,185 | 8,181 | 8,057 | 8,097 | 6,648 | 6,397 | 6,521 | 7,703 | 6,224 | 6,328 | 6,290 |
| 1998 | 7,906 | 7,333 | 7,720 | 7,650 | 7,777 | 7,410 | 6,429 | 6,835 | 6,790 | 7,551 | 8,348 | 9,405 |
| 1999 | 7,786 | 7,280 | 7,176 | 7,646 | 8,196 | 8,824 | 7,086 | 7,540 | 8,188 | 7,626 | 8,205 | 9,033 |
| 2000 | 8,735 | 8,757 | 8,478 | 9,058 | 9,534 | 7,457 | 7,400 | 8,406 | 7,546 | 7,500 | 7,104 | 6,765 |
| 2001 | 6,634 | 7,196 | 8,269 | 7,772 | 7,979 | 8,217 | 7,545 | 7,991 | 8,115 | 7,959 | 7,546 | 7,388 |
| 2002 | 6,154 | 5,999 | 6,279 | 5,934 | 6,782 | 6,001 | 4,629 | 5,967 | 5,373 | 7,565 | 6,193 | 6,252 |
| 2003 | 6,564 | 5,395 | 6,052 | 5,791 | 5,305 | 6,045 | 5,552 | 7,051 | 6,575 | 6,352 | 6,025 | 6,430 |
| 2004 | 7,781 | 7,816 | 8,715 | 6,956 | 7,671 | 7,675 | 7,062 | 7,291 | 8,020 | 9,424 | 8,362 | 8,546 |
| 2005 | 7,040 | 6,575 | 9,153 | 7,906 | 8,514 | 7,973 | 9,347 | 8,634 | 7,512 | 7,717 | 7,812 | 7,798 |
| 2006 | 10,110 | 10,207 | 9,939 | 9,569 | 9,544 | 8,390 | 9,355 | 7,795 | 8,543 | 8,771 | 8,651 | 9,916 |
| 2007 | 10,379 | 7,976 | 9,400 | 8,779 | 8,482 | 8,914 | 9,827 | 10,432 | 9,602 | 10,380 | 10,017 | 11,496 |
| 2008 | 11,531 | 10,068 | 11,568 | 9,937 | 10,954 | 10,189 | 10,454 | 10,481 | 9,104 | 11,073 | 11,280 | 10,542 |
| 2009 | 10,642 | 10,504 | 11,835 | 11,039 | 11,796 | 11,093 | 11,325 | 12,588 | 13,825 | 13,877 | 12,612 | 12,595 |
| 2010 | 19,321 | 18,811 | 21,209 | 21,046 | 21,560 | 22,378 | 23,487 | 24,115 | 24,285 | 25,600 | 27,078 | 24,604 |
| 2011 | 26,001 | 26,118 | 30,179 | 28,131 | 28,199 | 29,211 | 29,101 | 28,994 | 27,712 | 28,480 | 31,833 | 32,697 |
| 2012 | 34,270 | 30,711 | 33,374 | 31,023 | 33,265 | 37,006 | 40,532 | 37,395 | 35,025 | 37,254 | 36,239 | 37,790 |
| 2013 | 37,050 | 37,521 | 43,709 | 43,225 | 45,566 | 41,288 | 42,616 | 42,894 | 42,561 | 42,323 | 38,060 | 40,472 |
| 2014 | 36,688 | 45,928 | 48,916 | 43,474 | 47,858 | 42,382 | 46,142 | 43,687 | 42,028 | 49,061 | 42,980 | 43,237 |
| 2015 | 46,726 | 42,763 | 52,127 | 59,188 | 63,230 | 57,673 | 58,666 | 60,411 | 64,697 | 58,287 | 50,095 | 56,754 |
| 2016 | 57,619 | 51,931 | 62,280 | 63,192 | 59,453 | 56,966 | 56,742 | 63,177 | 63,795 | 66,204 | 64,963 | 62,691 |
| 2017 | 66,807 | 62,445 | 70,189 | 69,444 | 74,798 | 74,398 | 77,181 | 74,193 | 70,965 | 84,556 | 85,416 | 91,171 |
| 2018 | 92,466 | 81,547 | 83,615 | 85,257 | 90,071 | 91,470 | 88,950 | 83,500 | 93,207 | 99,523 | 98,173 | 101,376 |
| 2019 | 105,076 | 95,279 | 110,278 | 107,530 | 108,886 | 107,356 | 108,359 | 109,379 | 99,276 | 103,538 | 97,914 | 101,196 |
| 2020 | 101,759 | 99,612 | 102,016 | 87,989 | 89,853 | 81,870 | 82,881 | 83,755 | 80,468 | 83,510 | 86,873 | 97,359 |
| 2021 | 99,076 | 75,736 | 91,337 | 91,980 | 94,779 | 95,068 | 97,767 | 92,533 | 88,265 | 97,525 | 100,441 | 104,582 |
| 2022 | 101,887 | 90,200 | 104,290 | 95,062 | 99,383 | 94,372 | 98,687 | 104,428 | 94,581 | 96,514 | 102,707 | 95,540 |
| 2023 | 95,519 | 98,020 | 115,196 | 113,332 | 110,637 | 102,338 | 111,380 | 109,702 | 112,903 | 119,621 | 114,550 | 113,316 |
| 2024 | 105,502 | 103,281 | 120,927 | 115,936 | 118,025 | 111,871 | ||||||
| - = No Data Reported; -- = Not Applicable; NA = Not Available; W = Withheld to avoid disclosure of individual company data. |
| Release Date: 8/30/2024 |
| Next Release Date: 9/30/2024 |