|
Download Data (XLS File) |
|
||||||||
|
||||||||
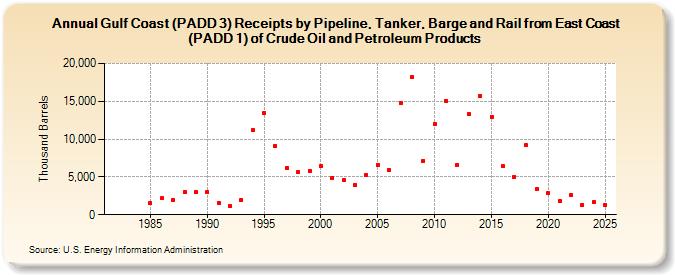
| Gulf Coast (PADD 3) Receipts by Pipeline, Tanker, Barge and Rail from East Coast (PADD 1) of Crude Oil and Petroleum Products (Thousand Barrels) | ||||||||
| Decade | Year-0 | Year-1 | Year-2 | Year-3 | Year-4 | Year-5 | Year-6 | Year-7 | Year-8 | Year-9 |
|---|---|---|---|---|---|---|---|---|---|---|
| 1980's | NA | NA | NA | NA | 1,543 | 2,166 | 1,980 | 3,004 | 2,984 | |
| 1990's | 3,015 | 1,592 | 1,180 | 1,964 | 11,145 | 13,422 | 9,122 | 6,238 | 5,602 | 5,838 |
| 2000's | 6,436 | 4,918 | 4,561 | 3,937 | 5,250 | 6,627 | 5,891 | 14,822 | 18,149 | 7,145 |
| 2010's | 11,966 | 15,050 | 6,569 | 13,255 | 15,751 | 12,966 | 6,422 | 5,027 | 9,163 | 3,355 |
| 2020's | 2,848 | 1,829 | 2,637 | 1,265 |
| - = No Data Reported; -- = Not Applicable; NA = Not Available; W = Withheld to avoid disclosure of individual company data. |
| Release Date: 6/28/2024 |
| Next Release Date: 8/30/2024 |