|
Download Data (XLS File) |
|
||||||||
|
||||||||
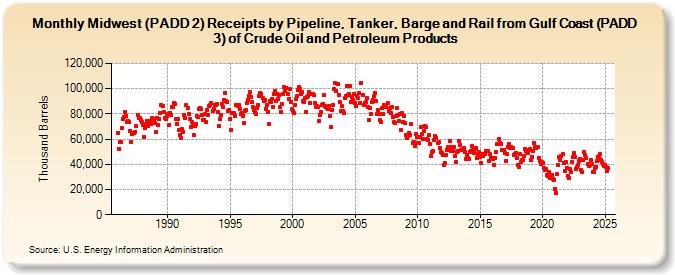
| Midwest (PADD 2) Receipts by Pipeline, Tanker, Barge and Rail from Gulf Coast (PADD 3) of Crude Oil and Petroleum Products (Thousand Barrels) | ||||||||
| Year | Jan | Feb | Mar | Apr | May | Jun | Jul | Aug | Sep | Oct | Nov | Dec |
|---|---|---|---|---|---|---|---|---|---|---|---|---|
| 1986 | 64,828 | 52,156 | 57,793 | 57,883 | 68,595 | 76,226 | 77,201 | 81,667 | 78,593 | 73,698 | 74,098 | 73,369 |
| 1987 | 66,742 | 57,688 | 64,378 | 64,566 | 65,211 | 65,827 | 70,183 | 79,265 | 76,379 | 76,767 | 75,129 | 73,637 |
| 1988 | 71,393 | 61,745 | 68,526 | 71,615 | 74,177 | 70,389 | 73,925 | 74,545 | 72,108 | 77,067 | 75,676 | 75,035 |
| 1989 | 73,051 | 65,615 | 76,631 | 70,816 | 75,894 | 80,832 | 87,381 | 86,639 | 81,690 | 77,119 | 75,714 | 78,168 |
| 1990 | 79,543 | 71,331 | 80,816 | 79,360 | 85,201 | 85,142 | 88,666 | 87,879 | 75,563 | 72,308 | 76,292 | 67,385 |
| 1991 | 63,441 | 60,839 | 67,954 | 65,996 | 79,020 | 77,091 | 86,974 | 84,418 | 79,928 | 76,217 | 69,336 | 73,443 |
| 1992 | 70,081 | 63,383 | 70,724 | 71,693 | 78,029 | 77,388 | 84,148 | 84,505 | 83,501 | 78,938 | 75,230 | 75,092 |
| 1993 | 79,807 | 73,792 | 83,238 | 78,865 | 85,876 | 87,410 | 88,340 | 82,541 | 84,254 | 87,143 | 87,271 | 87,543 |
| 1994 | 81,430 | 70,067 | 75,881 | 79,333 | 87,983 | 85,837 | 91,208 | 96,901 | 90,115 | 89,097 | 82,543 | 83,307 |
| 1995 | 75,668 | 67,572 | 80,317 | 80,850 | 80,358 | 78,681 | 87,397 | 86,631 | 86,711 | 83,680 | 79,599 | 80,891 |
| 1996 | 78,470 | 73,126 | 82,430 | 83,079 | 88,364 | 91,181 | 94,401 | 97,060 | 93,400 | 89,132 | 85,238 | 82,939 |
| 1997 | 81,132 | 79,874 | 84,595 | 87,131 | 94,511 | 96,687 | 95,866 | 92,913 | 89,843 | 91,229 | 83,973 | 86,968 |
| 1998 | 81,743 | 71,751 | 89,994 | 89,617 | 92,189 | 85,400 | 95,535 | 98,537 | 89,877 | 95,825 | 91,677 | 95,101 |
| 1999 | 85,738 | 81,431 | 87,557 | 95,523 | 101,051 | 98,455 | 100,615 | 96,107 | 91,543 | 99,535 | 89,780 | 83,813 |
| 2000 | 82,102 | 80,831 | 86,772 | 91,743 | 93,884 | 98,568 | 101,473 | 99,843 | 95,709 | 97,184 | 90,230 | 89,458 |
| 2001 | 92,473 | 81,734 | 93,330 | 94,364 | 97,085 | 88,303 | 95,660 | 95,854 | 94,806 | 88,466 | 85,588 | 86,580 |
| 2002 | 85,669 | 74,037 | 79,450 | 81,106 | 87,334 | 88,009 | 95,048 | 85,901 | 85,301 | 84,963 | 83,498 | 85,892 |
| 2003 | 78,169 | 69,988 | 82,999 | 87,394 | 99,356 | 104,174 | 98,021 | 103,362 | 94,873 | 89,741 | 82,132 | 86,145 |
| 2004 | 82,313 | 80,940 | 92,675 | 94,557 | 101,827 | 94,650 | 95,661 | 102,140 | 89,758 | 93,671 | 90,827 | 95,763 |
| 2005 | 88,486 | 86,205 | 93,922 | 92,360 | 96,258 | 88,716 | 104,855 | 94,860 | 86,821 | 88,556 | 89,245 | 92,544 |
| 2006 | 85,275 | 75,474 | 84,886 | 80,257 | 89,168 | 91,138 | 93,829 | 96,934 | 90,282 | 79,995 | 82,913 | 80,272 |
| 2007 | 74,768 | 73,666 | 84,428 | 80,085 | 87,008 | 85,597 | 85,086 | 88,511 | 82,108 | 84,327 | 80,799 | 85,438 |
| 2008 | 77,899 | 73,216 | 72,758 | 78,034 | 84,775 | 79,317 | 74,748 | 79,803 | 67,439 | 80,991 | 73,441 | 78,216 |
| 2009 | 72,450 | 63,417 | 60,720 | 62,636 | 65,117 | 63,408 | 71,654 | 57,272 | 57,492 | 54,870 | 63,691 | 61,645 |
| 2010 | 56,586 | 56,642 | 61,797 | 69,413 | 64,096 | 60,403 | 66,784 | 70,621 | 69,381 | 59,876 | 59,500 | 63,164 |
| 2011 | 55,868 | 46,935 | 49,723 | 50,675 | 59,480 | 62,092 | 60,618 | 57,065 | 57,488 | 52,550 | 49,441 | 49,120 |
| 2012 | 47,194 | 39,706 | 41,011 | 47,168 | 51,697 | 53,853 | 51,532 | 58,668 | 50,174 | 53,846 | 50,893 | 53,731 |
| 2013 | 46,378 | 42,112 | 49,823 | 50,532 | 58,587 | 55,579 | 51,480 | 51,822 | 52,767 | 49,778 | 44,340 | 47,125 |
| 2014 | 45,084 | 43,910 | 50,153 | 50,859 | 54,363 | 51,295 | 48,717 | 51,926 | 53,056 | 45,238 | 47,945 | 50,042 |
| 2015 | 45,531 | 41,308 | 48,497 | 46,680 | 48,239 | 48,228 | 50,579 | 50,495 | 42,719 | 47,823 | 45,365 | 44,849 |
| 2016 | 44,514 | 39,393 | 45,004 | 49,708 | 55,775 | 56,484 | 60,090 | 57,086 | 55,828 | 51,432 | 51,383 | 51,496 |
| 2017 | 48,856 | 42,914 | 48,185 | 53,743 | 56,009 | 52,590 | 53,721 | 52,806 | 47,490 | 48,437 | 48,932 | 44,893 |
| 2018 | 39,462 | 37,468 | 47,897 | 41,475 | 43,584 | 43,538 | 46,898 | 51,773 | 50,704 | 49,653 | 49,223 | 51,541 |
| 2019 | 51,797 | 43,679 | 46,048 | 50,607 | 56,877 | 53,561 | 52,732 | 54,004 | 44,942 | 42,229 | 40,083 | 41,525 |
| 2020 | 40,645 | 37,214 | 35,340 | 35,967 | 31,538 | 30,694 | 33,706 | 28,755 | 28,955 | 31,909 | 28,713 | 27,939 |
| 2021 | 20,771 | 17,296 | 31,994 | 39,750 | 45,810 | 43,250 | 46,644 | 48,305 | 40,655 | 34,674 | 41,636 | 37,222 |
| 2022 | 30,841 | 28,813 | 35,997 | 33,905 | 41,783 | 45,562 | 48,956 | 46,139 | 36,545 | 37,823 | 39,379 | 42,389 |
| 2023 | 44,250 | 35,316 | 34,342 | 43,555 | 49,461 | 47,129 | 44,725 | 40,068 | 38,423 | 39,607 | 43,101 | 39,977 |
| 2024 | 33,604 | 34,116 | 36,990 | 38,164 | ||||||||
| - = No Data Reported; -- = Not Applicable; NA = Not Available; W = Withheld to avoid disclosure of individual company data. |
| Release Date: 6/28/2024 |
| Next Release Date: 7/31/2024 |