|
Download Data (XLS File) |
|
||||||||
|
||||||||
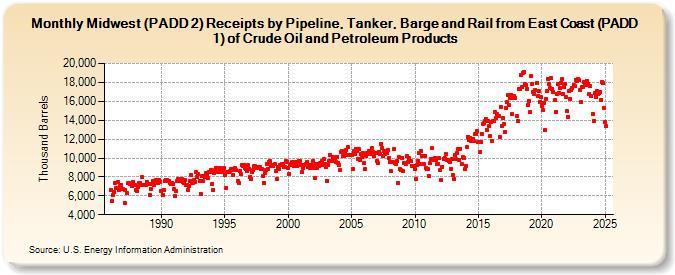
| Midwest (PADD 2) Receipts by Pipeline, Tanker, Barge and Rail from East Coast (PADD 1) of Crude Oil and Petroleum Products (Thousand Barrels) | ||||||||
| Year | Jan | Feb | Mar | Apr | May | Jun | Jul | Aug | Sep | Oct | Nov | Dec |
|---|---|---|---|---|---|---|---|---|---|---|---|---|
| 1986 | 6,627 | 5,429 | 6,042 | 6,414 | 7,350 | 6,852 | 6,838 | 7,492 | 6,625 | 7,005 | 7,147 | 6,681 |
| 1987 | 6,709 | 5,240 | 6,585 | 6,343 | 7,327 | 7,318 | 7,214 | 7,269 | 7,039 | 7,441 | 7,095 | 7,115 |
| 1988 | 6,602 | 6,494 | 6,967 | 7,384 | 7,340 | 7,122 | 7,959 | 7,188 | 7,166 | 7,161 | 7,497 | 7,260 |
| 1989 | 7,286 | 6,107 | 6,740 | 7,298 | 7,560 | 7,186 | 7,528 | 7,655 | 7,643 | 7,383 | 7,679 | 7,511 |
| 1990 | 6,498 | 6,134 | 6,636 | 7,552 | 7,705 | 7,651 | 7,524 | 7,616 | 7,400 | 7,283 | 7,354 | 7,221 |
| 1991 | 6,737 | 5,979 | 6,545 | 7,534 | 7,804 | 7,640 | 7,549 | 7,755 | 7,415 | 7,403 | 7,644 | 7,107 |
| 1992 | 7,193 | 6,603 | 7,066 | 7,543 | 8,212 | 7,376 | 7,379 | 7,660 | 7,472 | 8,486 | 7,945 | 8,265 |
| 1993 | 7,576 | 6,231 | 8,073 | 7,546 | 8,074 | 8,036 | 8,361 | 8,188 | 7,897 | 8,470 | 8,478 | 8,699 |
| 1994 | 7,237 | 6,562 | 8,464 | 8,746 | 8,975 | 8,660 | 8,494 | 8,952 | 8,510 | 8,503 | 8,596 | 8,917 |
| 1995 | 8,245 | 6,811 | 8,555 | 8,566 | 8,503 | 8,620 | 8,821 | 8,758 | 8,219 | 8,794 | 8,931 | 8,721 |
| 1996 | 7,598 | 7,326 | 8,616 | 8,334 | 9,278 | 9,194 | 9,298 | 8,988 | 8,790 | 8,650 | 9,222 | 8,857 |
| 1997 | 8,027 | 7,827 | 8,509 | 8,745 | 9,167 | 9,105 | 8,959 | 9,048 | 9,014 | 9,090 | 8,793 | 8,800 |
| 1998 | 8,045 | 7,354 | 8,364 | 8,751 | 9,317 | 8,810 | 9,576 | 9,666 | 9,146 | 9,233 | 9,123 | 9,333 |
| 1999 | 8,658 | 7,746 | 9,015 | 8,867 | 9,264 | 9,242 | 9,336 | 9,335 | 9,032 | 9,050 | 9,682 | 9,605 |
| 2000 | 8,894 | 8,346 | 9,286 | 9,346 | 9,526 | 9,115 | 9,553 | 9,588 | 9,124 | 9,531 | 9,695 | 9,690 |
| 2001 | 9,264 | 8,500 | 8,951 | 9,213 | 9,279 | 9,334 | 9,611 | 9,004 | 9,239 | 8,989 | 9,267 | 9,655 |
| 2002 | 8,930 | 7,840 | 9,350 | 8,977 | 9,325 | 9,192 | 9,487 | 9,243 | 9,668 | 9,283 | 9,866 | 9,320 |
| 2003 | 9,039 | 7,571 | 9,271 | 9,728 | 10,274 | 9,646 | 10,126 | 10,016 | 9,995 | 9,554 | 10,143 | 9,476 |
| 2004 | 9,259 | 8,748 | 10,654 | 10,694 | 10,231 | 10,220 | 10,609 | 10,868 | 10,272 | 11,120 | 10,274 | 10,283 |
| 2005 | 10,309 | 8,824 | 10,700 | 10,455 | 10,981 | 10,747 | 9,927 | 10,951 | 9,770 | 10,474 | 10,154 | 10,523 |
| 2006 | 9,521 | 8,828 | 10,249 | 10,477 | 10,758 | 10,425 | 10,700 | 11,055 | 10,609 | 10,175 | 10,527 | 10,520 |
| 2007 | 9,685 | 9,421 | 10,673 | 10,458 | 11,443 | 11,045 | 10,243 | 10,755 | 10,454 | 10,562 | 10,822 | 9,953 |
| 2008 | 9,535 | 8,597 | 9,628 | 9,603 | 10,923 | 9,463 | 9,414 | 9,663 | 7,399 | 10,073 | 8,804 | 8,684 |
| 2009 | 9,953 | 8,583 | 9,472 | 9,360 | 10,206 | 9,602 | 10,042 | 9,674 | 9,651 | 9,165 | 9,156 | 9,130 |
| 2010 | 8,798 | 7,754 | 9,254 | 9,661 | 10,488 | 9,344 | 10,752 | 10,174 | 9,353 | 10,192 | 8,954 | 8,808 |
| 2011 | 8,878 | 8,085 | 9,465 | 9,880 | 11,022 | 9,851 | 9,794 | 10,041 | 9,754 | 9,353 | 9,413 | 9,949 |
| 2012 | 8,689 | 7,696 | 9,075 | 9,945 | 10,047 | 10,443 | 9,798 | 9,757 | 9,656 | 9,534 | 8,812 | 9,908 |
| 2013 | 8,214 | 7,808 | 10,280 | 9,842 | 10,478 | 10,915 | 9,817 | 10,988 | 9,348 | 10,082 | 10,044 | 8,795 |
| 2014 | 9,102 | 11,212 | 12,274 | 11,913 | 12,146 | 11,803 | 11,773 | 12,019 | 11,755 | 12,584 | 12,563 | 12,889 |
| 2015 | 11,706 | 10,592 | 11,644 | 12,576 | 13,602 | 13,681 | 13,867 | 14,135 | 12,996 | 13,924 | 13,363 | 12,332 |
| 2016 | 13,793 | 11,797 | 13,905 | 13,954 | 14,823 | 14,235 | 14,633 | 14,483 | 12,263 | 15,439 | 13,414 | 14,180 |
| 2017 | 13,625 | 12,730 | 15,309 | 15,879 | 16,629 | 15,583 | 16,360 | 16,711 | 14,665 | 16,312 | 16,509 | 16,374 |
| 2018 | 14,396 | 13,961 | 17,289 | 17,349 | 18,748 | 17,557 | 18,985 | 19,138 | 17,816 | 17,714 | 17,293 | 15,607 |
| 2019 | 16,031 | 14,865 | 18,675 | 17,846 | 16,988 | 16,820 | 17,211 | 17,889 | 16,513 | 17,053 | 15,976 | 16,483 |
| 2020 | 15,541 | 15,049 | 15,767 | 12,930 | 16,267 | 17,134 | 18,372 | 17,854 | 17,375 | 18,462 | 17,320 | 16,970 |
| 2021 | 16,122 | 14,909 | 16,797 | 17,803 | 16,908 | 17,366 | 17,920 | 18,338 | 16,733 | 17,480 | 17,816 | 16,430 |
| 2022 | 14,961 | 14,318 | 17,046 | 16,264 | 17,175 | 17,451 | 17,739 | 17,619 | 18,290 | 18,177 | 18,319 | 18,287 |
| 2023 | 17,198 | 15,903 | 17,527 | 17,483 | 18,035 | 17,941 | 17,747 | 18,183 | 17,809 | 16,790 | 17,586 | 16,515 |
| 2024 | 14,872 | |||||||||||
| - = No Data Reported; -- = Not Applicable; NA = Not Available; W = Withheld to avoid disclosure of individual company data. |
| Release Date: 3/29/2024 |
| Next Release Date: 4/30/2024 |