|
Download Data (XLS File) |
|
||||||||
|
||||||||
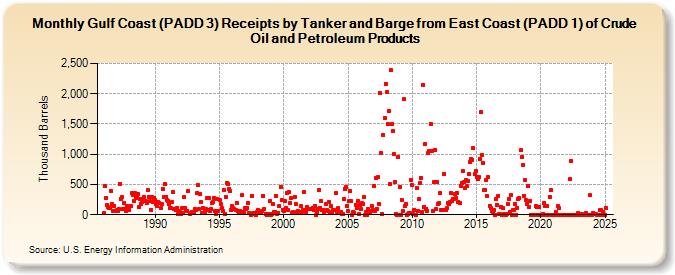
| Gulf Coast (PADD 3) Receipts by Tanker and Barge from East Coast (PADD 1) of Crude Oil and Petroleum Products (Thousand Barrels) | ||||||||
| Year | Jan | Feb | Mar | Apr | May | Jun | Jul | Aug | Sep | Oct | Nov | Dec |
|---|---|---|---|---|---|---|---|---|---|---|---|---|
| 1986 | 33 | 469 | 284 | 165 | 132 | 106 | 117 | 397 | 181 | 65 | 148 | 69 |
| 1987 | 77 | 59 | 98 | 516 | 263 | 286 | 92 | 194 | 87 | 62 | 147 | 99 |
| 1988 | 79 | 151 | 354 | 333 | 225 | 364 | 279 | 314 | 339 | 131 | 252 | 183 |
| 1989 | 216 | 261 | 296 | 229 | 189 | 403 | 299 | 221 | 85 | 296 | 210 | 279 |
| 1990 | 242 | 172 | 152 | 213 | 196 | 104 | 180 | 428 | 286 | 502 | 298 | 242 |
| 1991 | 223 | 181 | 105 | 104 | 205 | 371 | 100 | 71 | 109 | 9 | 66 | 48 |
| 1992 | 10 | 105 | 26 | 296 | 104 | 64 | 66 | 392 | 20 | 25 | 45 | 27 |
| 1993 | 28 | 101 | 77 | 354 | 489 | 87 | 339 | 210 | 28 | 113 | 43 | 95 |
| 1994 | 275 | 85 | 281 | 63 | 91 | 198 | 218 | 283 | 67 | 11 | 253 | 60 |
| 1995 | 243 | 177 | 106 | 63 | 416 | 10 | 300 | 517 | 504 | 432 | 386 | 82 |
| 1996 | 144 | 104 | 87 | 78 | 198 | 56 | 22 | 68 | 37 | 320 | 37 | 27 |
| 1997 | 115 | 95 | 118 | 198 | 27 | 0 | 317 | 23 | 19 | 21 | 0 | 48 |
| 1998 | 76 | 27 | 48 | 37 | 66 | 312 | 97 | 20 | 0 | 20 | 9 | 223 |
| 1999 | 0 | 17 | 177 | 37 | 47 | 314 | 19 | 32 | 139 | 455 | 236 | 83 |
| 2000 | 68 | 221 | 107 | 362 | 72 | 369 | 186 | 270 | 25 | 39 | 297 | 185 |
| 2001 | 46 | 69 | 52 | 48 | 137 | 52 | 85 | 377 | 85 | 40 | 126 | 88 |
| 2002 | 93 | 102 | 98 | 119 | 79 | 149 | 0 | 38 | 89 | 411 | 117 | 223 |
| 2003 | 79 | 78 | 50 | 177 | 75 | 63 | 210 | 26 | 143 | 41 | 79 | 85 |
| 2004 | 355 | 45 | 105 | 45 | 19 | 15 | 258 | 428 | 458 | 142 | ||
| 2005 | 55 | 223 | 390 | 222 | 0 | 45 | 33 | 166 | 105 | 222 | 10 | 154 |
| 2006 | 91 | 186 | 178 | 290 | 0 | 42 | 0 | 92 | 21 | 61 | 140 | 78 |
| 2007 | 480 | 67 | 615 | 99 | 621 | 179 | 2,010 | 1,013 | 18 | 1,315 | 1,601 | 2,167 |
| 2008 | 2,028 | 1,492 | 1,714 | 508 | 2,386 | 1,501 | 1,382 | 1,011 | 536 | 10 | 0 | 961 |
| 2009 | 455 | 0 | 251 | 60 | 1,905 | 138 | 184 | 1 | 4 | 23 | 22 | 575 |
| 2010 | 490 | 6 | 86 | 1 | 443 | 68 | 253 | 527 | 615 | 50 | 2,146 | 134 |
| 2011 | 1,165 | 101 | 66 | 1,017 | 1,046 | 1,506 | 1,060 | 64 | 536 | 1,066 | 94 | 539 |
| 2012 | 185 | 189 | 351 | 71 | 77 | 82 | 678 | 73 | 106 | 194 | 183 | 211 |
| 2013 | 365 | 222 | 264 | 268 | 338 | 276 | 361 | 215 | 201 | 482 | 525 | 723 |
| 2014 | 538 | 440 | 569 | 475 | 556 | 681 | 876 | 919 | 911 | 1,108 | 673 | 718 |
| 2015 | 624 | 596 | 617 | 923 | 1,697 | 991 | 851 | 416 | 408 | 575 | 304 | 619 |
| 2016 | 150 | 109 | 55 | 50 | 75 | 0 | 257 | 168 | 316 | 10 | 9 | 134 |
| 2017 | 0 | 103 | 10 | 0 | 17 | 175 | 252 | 53 | 322 | 0 | 80 | 78 |
| 2018 | 181 | 0 | 113 | 265 | 269 | 1,062 | 953 | 825 | 316 | 566 | 241 | 176 |
| 2019 | 473 | 129 | 231 | 0 | 0 | 0 | 0 | 141 | 121 | 0 | 133 | 0 |
| 2020 | 0 | 0 | 20 | 194 | 150 | 0 | 143 | 0 | 297 | 404 | 0 | 0 |
| 2021 | 0 | 0 | 50 | 0 | 143 | 103 | 0 | 0 | 0 | 0 | 0 | 0 |
| 2022 | 0 | 0 | 0 | 589 | 895 | 0 | 0 | 0 | 0 | 0 | 0 | 31 |
| 2023 | 0 | 0 | 10 | 0 | 0 | 0 | 33 | 0 | 0 | 0 | 318 | 0 |
| 2024 | 0 | |||||||||||
| - = No Data Reported; -- = Not Applicable; NA = Not Available; W = Withheld to avoid disclosure of individual company data. |
| Release Date: 3/29/2024 |
| Next Release Date: 4/30/2024 |