|
Download Data (XLS File) |
|
||||||||
|
||||||||
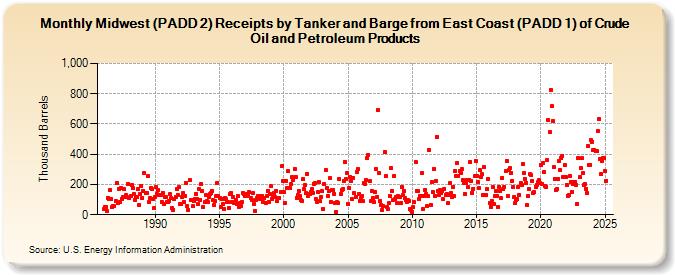
| Midwest (PADD 2) Receipts by Tanker and Barge from East Coast (PADD 1) of Crude Oil and Petroleum Products (Thousand Barrels) | ||||||||
| Year | Jan | Feb | Mar | Apr | May | Jun | Jul | Aug | Sep | Oct | Nov | Dec |
|---|---|---|---|---|---|---|---|---|---|---|---|---|
| 1986 | 35 | 50 | 54 | 22 | 113 | 105 | 166 | 104 | 50 | 55 | 55 | 91 |
| 1987 | 210 | 76 | 172 | 87 | 179 | 105 | 114 | 167 | 118 | 130 | 115 | 204 |
| 1988 | 109 | 123 | 198 | 179 | 137 | 100 | 118 | 120 | 167 | 66 | 138 | 190 |
| 1989 | 111 | 159 | 277 | 142 | 142 | 253 | 85 | 112 | 178 | 167 | 101 | 43 |
| 1990 | 120 | 182 | 135 | 162 | 131 | 131 | 86 | 146 | 69 | 118 | 116 | 81 |
| 1991 | 82 | 89 | 134 | 109 | 44 | 34 | 101 | 120 | 168 | 130 | 180 | 71 |
| 1992 | 70 | 116 | 143 | 87 | 127 | 211 | 57 | 33 | 227 | 96 | 96 | 55 |
| 1993 | 92 | 107 | 139 | 102 | 70 | 169 | 98 | 204 | 157 | 51 | 81 | 128 |
| 1994 | 92 | 82 | 114 | 136 | 142 | 160 | 94 | 63 | 88 | 126 | 213 | 123 |
| 1995 | 109 | 53 | 102 | 70 | 41 | 113 | 105 | 87 | 84 | 44 | 135 | 142 |
| 1996 | 87 | 118 | 77 | 100 | 71 | 125 | 54 | 76 | 60 | 84 | 144 | 135 |
| 1997 | 121 | 137 | 127 | 132 | 147 | 109 | 99 | 142 | 73 | 27 | 100 | 112 |
| 1998 | 123 | 115 | 106 | 127 | 125 | 82 | 110 | 80 | 125 | 159 | 87 | 139 |
| 1999 | 187 | 104 | 115 | 144 | 117 | 158 | 89 | 111 | 111 | 150 | 319 | 224 |
| 2000 | 153 | 78 | 226 | 177 | 289 | 178 | 177 | 203 | 251 | 231 | 303 | 252 |
| 2001 | 111 | 129 | 158 | 127 | 100 | 90 | 236 | 168 | 195 | 143 | 272 | 127 |
| 2002 | 140 | 153 | 168 | 141 | 205 | 210 | 101 | 86 | 151 | 216 | 88 | 117 |
| 2003 | 154 | 37 | 203 | 296 | 176 | 124 | 156 | 240 | 86 | 162 | 164 | 140 |
| 2004 | 80 | 21 | 83 | 76 | 239 | 134 | 162 | 167 | 225 | 350 | 233 | 275 |
| 2005 | 71 | 175 | 250 | 222 | 102 | 244 | 142 | 118 | 281 | 301 | 139 | 90 |
| 2006 | 108 | 121 | 89 | 209 | 205 | 228 | 373 | 398 | 220 | 89 | 158 | 108 |
| 2007 | 84 | 150 | 305 | 120 | 694 | 275 | 90 | 63 | 34 | 56 | 414 | 254 |
| 2008 | 50 | 37 | 75 | 125 | 308 | 156 | 98 | 256 | 102 | 114 | 76 | 121 |
| 2009 | 115 | 75 | 183 | 128 | 159 | 108 | 96 | 87 | 96 | 93 | 39 | 28 |
| 2010 | 19 | 48 | 81 | 350 | 160 | 154 | 102 | 127 | 122 | 275 | 38 | 126 |
| 2011 | 166 | 135 | 55 | 122 | 429 | 66 | 215 | 153 | 305 | 127 | 225 | 517 |
| 2012 | 155 | 131 | 166 | 143 | 157 | 102 | 173 | 129 | 134 | 75 | 129 | 208 |
| 2013 | 141 | 117 | 186 | 123 | 290 | 257 | 342 | 258 | 287 | 274 | 300 | 227 |
| 2014 | 213 | 140 | 209 | 232 | 180 | 232 | 351 | 225 | 146 | 173 | 253 | 356 |
| 2015 | 255 | 215 | 177 | 294 | 251 | 266 | 130 | 317 | 131 | 130 | 170 | 236 |
| 2016 | 76 | 53 | 92 | 185 | 71 | 125 | 157 | 124 | 53 | 186 | 159 | 113 |
| 2017 | 246 | 170 | 186 | 287 | 358 | 125 | 294 | 307 | 279 | 224 | 183 | 114 |
| 2018 | 75 | 98 | 101 | 185 | 129 | 211 | 199 | 334 | 277 | 239 | 211 | 61 |
| 2019 | 124 | 170 | 268 | 260 | 224 | 144 | 148 | 183 | 198 | 215 | 228 | 209 |
| 2020 | 330 | 204 | 344 | 281 | 190 | 184 | 361 | 624 | 545 | 826 | 718 | 621 |
| 2021 | 314 | 239 | 163 | 171 | 236 | 356 | 296 | 373 | 391 | 250 | 330 | 247 |
| 2022 | 199 | 126 | 132 | 257 | 215 | 151 | 200 | 219 | 219 | 197 | 74 | 373 |
| 2023 | 247 | 308 | 372 | 274 | 196 | 202 | 173 | 146 | 454 | 329 | 331 | 492 |
| 2024 | 483 | 430 | 427 | 418 | 418 | 553 | 631 | 366 | 269 | 352 | 376 | 377 |
| 2025 | 287 | 223 | 514 | 501 | ||||||||
| - = No Data Reported; -- = Not Applicable; NA = Not Available; W = Withheld to avoid disclosure of individual company data. |
| Release Date: 6/30/2025 |
| Next Release Date: 7/31/2025 |