|
Download Data (XLS File) |
|
||||||||
|
||||||||
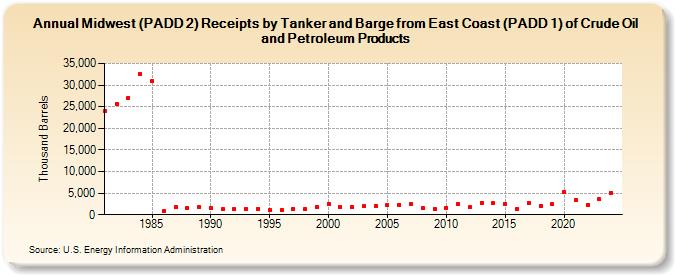
| Midwest (PADD 2) Receipts by Tanker and Barge from East Coast (PADD 1) of Crude Oil and Petroleum Products (Thousand Barrels) | ||||||||
| Decade | Year-0 | Year-1 | Year-2 | Year-3 | Year-4 | Year-5 | Year-6 | Year-7 | Year-8 | Year-9 |
|---|---|---|---|---|---|---|---|---|---|---|
| 1980's | 23,991 | 25,660 | 27,064 | 32,582 | 30,834 | 900 | 1,677 | 1,645 | 1,770 | |
| 1990's | 1,477 | 1,262 | 1,318 | 1,398 | 1,433 | 1,085 | 1,131 | 1,326 | 1,378 | 1,829 |
| 2000's | 2,518 | 1,856 | 1,776 | 1,938 | 2,045 | 2,135 | 2,306 | 2,539 | 1,518 | 1,207 |
| 2010's | 1,602 | 2,515 | 1,702 | 2,802 | 2,710 | 2,572 | 1,394 | 2,773 | 2,120 | 2,371 |
| 2020's | 5,228 | 3,366 | 2,362 | 3,524 |
| - = No Data Reported; -- = Not Applicable; NA = Not Available; W = Withheld to avoid disclosure of individual company data. |
| Release Date: 6/28/2024 |
| Next Release Date: 8/30/2024 |