|
Download Data (XLS File) |
|
||||||||
|
||||||||
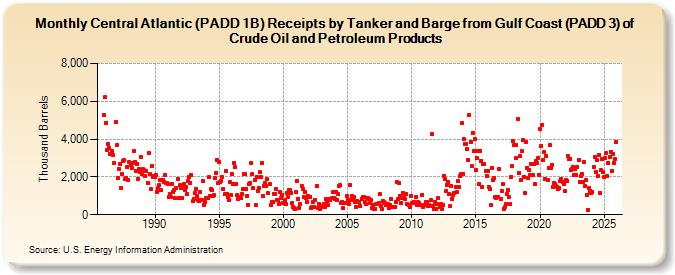
| Central Atlantic (PADD 1B) Receipts by Tanker and Barge from Gulf Coast (PADD 3) of Crude Oil and Petroleum Products (Thousand Barrels) | ||||||||
| Year | Jan | Feb | Mar | Apr | May | Jun | Jul | Aug | Sep | Oct | Nov | Dec |
|---|---|---|---|---|---|---|---|---|---|---|---|---|
| 1986 | 5,283 | 6,216 | 4,871 | 3,399 | 3,719 | 3,510 | 3,225 | 3,222 | 3,351 | 3,166 | 2,726 | 4,926 |
| 1987 | 3,670 | 1,926 | 2,439 | 2,657 | 1,410 | 2,170 | 2,817 | 2,896 | 1,906 | 1,917 | 2,544 | 1,825 |
| 1988 | 2,782 | 2,619 | 2,449 | 2,739 | 3,373 | 2,803 | 2,311 | 2,690 | 1,892 | 2,417 | 2,283 | 3,063 |
| 1989 | 2,142 | 2,395 | 2,367 | 2,044 | 2,289 | 1,685 | 3,242 | 2,139 | 1,370 | 2,555 | 1,998 | 2,031 |
| 1990 | 1,990 | 2,110 | 1,192 | 1,402 | 1,546 | 1,847 | 1,300 | 1,821 | 1,743 | 2,119 | 1,699 | 1,684 |
| 1991 | 1,633 | 933 | 1,104 | 957 | 1,612 | 1,187 | 1,330 | 860 | 1,417 | 1,895 | 868 | 1,571 |
| 1992 | 1,420 | 883 | 1,497 | 1,619 | 1,328 | 1,445 | 1,087 | 1,774 | 2,019 | 1,704 | 2,120 | 710 |
| 1993 | 847 | 1,126 | 1,384 | 986 | 755 | 702 | 1,180 | 795 | 768 | 1,773 | 523 | 670 |
| 1994 | 896 | 887 | 1,970 | 1,016 | 1,345 | 1,300 | 984 | 1,023 | 1,916 | 2,222 | 2,913 | 1,690 |
| 1995 | 2,795 | 1,717 | 1,792 | 1,991 | 1,378 | 1,083 | 2,320 | 1,117 | 929 | 768 | 1,717 | 1,024 |
| 1996 | 2,151 | 1,621 | 2,740 | 2,508 | 1,621 | 1,038 | 855 | 961 | 869 | 1,108 | 1,367 | 2,164 |
| 1997 | 2,128 | 1,343 | 986 | 533 | 1,606 | 1,678 | 2,738 | 2,162 | 1,427 | 1,836 | 521 | 2,013 |
| 1998 | 1,247 | 1,408 | 2,248 | 1,992 | 2,747 | 1,015 | 1,523 | 1,671 | 1,505 | 1,864 | 1,124 | 1,627 |
| 1999 | 496 | 681 | 659 | 1,099 | 1,080 | 1,354 | 791 | 791 | 578 | 1,193 | 866 | 1,034 |
| 2000 | 597 | 791 | 541 | 1,174 | 944 | 1,326 | 1,290 | 1,143 | 599 | 424 | 337 | 320 |
| 2001 | 1,203 | 1,771 | 848 | 356 | 566 | 1,503 | 1,356 | 953 | 1,221 | 892 | 684 | 1,000 |
| 2002 | 948 | 949 | 342 | 430 | 696 | 423 | 752 | 1,533 | 329 | 582 | 280 | 412 |
| 2003 | 453 | 451 | 574 | 401 | 819 | 651 | 511 | 853 | 796 | 890 | 1,181 | 864 |
| 2004 | 832 | 1,186 | 791 | 1,085 | 1,503 | 1,555 | 619 | 689 | 339 | 607 | 608 | 1,003 |
| 2005 | 780 | 558 | 1,550 | 787 | 1,000 | 802 | 922 | 680 | 403 | 717 | 654 | 659 |
| 2006 | 471 | 848 | 914 | 933 | 657 | 552 | 885 | 888 | 823 | 617 | 776 | 329 |
| 2007 | 517 | 285 | 306 | 554 | 591 | 597 | 1,079 | 435 | 291 | 715 | 664 | 604 |
| 2008 | 509 | 546 | 550 | 330 | 509 | 816 | 414 | 422 | 417 | 673 | 1,737 | 836 |
| 2009 | 1,673 | 997 | 636 | 910 | 1,171 | 916 | 813 | 1,088 | 587 | 522 | 411 | 1,014 |
| 2010 | 627 | 630 | 681 | 616 | 957 | 495 | 661 | 594 | 493 | 527 | 1,047 | 430 |
| 2011 | 535 | 660 | 672 | 481 | 521 | 450 | 774 | 4,276 | 479 | 294 | 681 | 322 |
| 2012 | 543 | 878 | 400 | 558 | 321 | 488 | 2,062 | 1,871 | 1,232 | 1,596 | 1,735 | 1,093 |
| 2013 | 450 | 1,511 | 827 | 1,020 | 1,171 | 1,456 | 1,214 | 1,760 | 1,458 | 2,045 | 2,152 | 4,853 |
| 2014 | 2,163 | 3,991 | 3,726 | 3,757 | 3,470 | 2,916 | 5,283 | 3,844 | 2,580 | 4,347 | 3,386 | 3,990 |
| 2015 | 2,374 | 2,997 | 3,389 | 1,613 | 3,388 | 2,857 | 1,477 | 2,670 | 2,661 | 2,319 | 2,053 | 2,319 |
| 2016 | 1,492 | 1,358 | 502 | 2,492 | 1,848 | 1,942 | 911 | 865 | 935 | 930 | 2,393 | 845 |
| 2017 | 1,255 | 1,618 | 325 | 394 | 555 | 1,075 | 1,307 | 918 | 553 | 2,021 | 2,593 | 3,881 |
| 2018 | 3,706 | 2,974 | 3,677 | 5,064 | 2,214 | 3,121 | 1,834 | 3,361 | 3,960 | 2,015 | 1,131 | 3,850 |
| 2019 | 2,493 | 1,923 | 2,375 | 2,076 | 2,667 | 2,087 | 2,687 | 1,615 | 2,863 | 2,710 | 2,989 | 2,109 |
| 2020 | 4,546 | 3,640 | 4,769 | 2,904 | 3,307 | 1,896 | 3,115 | 1,826 | 2,492 | 3,674 | 2,489 | 2,651 |
| 2021 | 1,467 | 1,702 | 1,647 | 1,505 | 1,484 | 1,364 | 1,389 | 1,769 | 1,871 | 1,737 | 1,628 | 1,254 |
| 2022 | 1,859 | 1,788 | 3,112 | 2,949 | 2,933 | 2,384 | 2,440 | 2,532 | 2,102 | 2,413 | 2,102 | 2,543 |
| 2023 | 2,884 | 1,748 | 2,041 | 2,159 | 1,723 | 2,806 | 1,499 | 1,847 | 1,064 | 262 | 1,399 | 1,275 |
| 2024 | 1,149 | |||||||||||
| - = No Data Reported; -- = Not Applicable; NA = Not Available; W = Withheld to avoid disclosure of individual company data. |
| Release Date: 3/29/2024 |
| Next Release Date: 4/30/2024 |