|
Download Data (XLS File) |
|
||||||||
|
||||||||
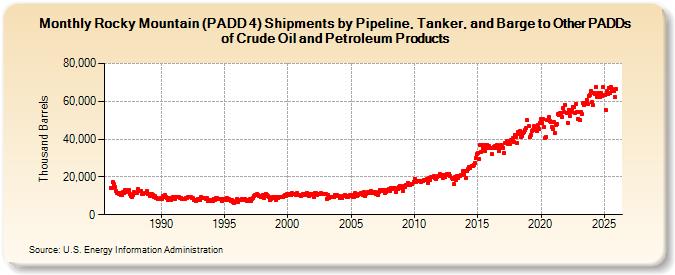
| Rocky Mountain (PADD 4) Shipments by Pipeline, Tanker, and Barge to Other PADDs of Crude Oil and Petroleum Products (Thousand Barrels) | ||||||||
| Year | Jan | Feb | Mar | Apr | May | Jun | Jul | Aug | Sep | Oct | Nov | Dec |
|---|---|---|---|---|---|---|---|---|---|---|---|---|
| 1986 | 14,324 | 13,916 | 17,081 | 16,077 | 14,739 | 12,489 | 11,487 | 11,229 | 10,783 | 11,522 | 10,394 | 10,690 |
| 1987 | 11,932 | 11,426 | 12,838 | 12,153 | 12,859 | 12,862 | 10,741 | 9,769 | 9,547 | 10,590 | 11,797 | 11,710 |
| 1988 | 11,703 | 11,712 | 13,535 | 12,629 | 12,548 | 12,624 | 10,988 | 11,212 | 11,372 | 11,369 | 12,389 | 10,978 |
| 1989 | 11,003 | 10,011 | 11,051 | 10,805 | 10,551 | 9,261 | 9,898 | 8,897 | 8,654 | 8,568 | 8,300 | 8,215 |
| 1990 | 8,580 | 8,508 | 9,855 | 10,248 | 9,257 | 8,848 | 7,786 | 8,959 | 8,065 | 7,796 | 8,770 | 9,251 |
| 1991 | 9,583 | 8,422 | 9,564 | 9,162 | 9,371 | 9,194 | 9,054 | 8,881 | 8,241 | 8,093 | 8,259 | 8,594 |
| 1992 | 9,016 | 9,191 | 9,221 | 9,338 | 9,473 | 9,066 | 8,704 | 7,682 | 7,994 | 7,309 | 7,761 | 8,504 |
| 1993 | 8,238 | 7,803 | 9,246 | 8,841 | 8,782 | 8,915 | 8,379 | 8,705 | 7,032 | 7,537 | 7,250 | 6,993 |
| 1994 | 7,551 | 7,229 | 8,391 | 7,779 | 8,933 | 8,719 | 8,554 | 8,431 | 8,149 | 7,445 | 8,140 | 8,144 |
| 1995 | 8,469 | 7,789 | 8,676 | 8,299 | 8,121 | 7,527 | 7,304 | 7,545 | 6,651 | 6,397 | 6,860 | 7,330 |
| 1996 | 8,451 | 6,835 | 7,643 | 8,005 | 8,340 | 7,950 | 8,124 | 8,144 | 7,736 | 7,504 | 7,772 | 7,382 |
| 1997 | 8,168 | 7,338 | 8,357 | 8,969 | 9,918 | 10,519 | 10,210 | 10,912 | 10,422 | 10,111 | 9,521 | 9,748 |
| 1998 | 10,549 | 8,967 | 10,584 | 11,156 | 10,574 | 10,021 | 9,132 | 7,958 | 8,355 | 8,963 | 9,456 | 9,197 |
| 1999 | 8,964 | 8,025 | 9,247 | 8,666 | 9,412 | 9,565 | 9,381 | 9,314 | 9,741 | 10,276 | 9,669 | 10,732 |
| 2000 | 10,675 | 10,306 | 10,755 | 10,406 | 11,301 | 10,919 | 10,924 | 11,028 | 10,311 | 11,439 | 10,498 | 10,491 |
| 2001 | 9,854 | 10,237 | 10,841 | 10,169 | 10,894 | 10,938 | 11,659 | 10,643 | 10,152 | 10,895 | 10,980 | 10,823 |
| 2002 | 10,590 | 9,184 | 11,266 | 11,301 | 10,623 | 10,855 | 11,063 | 11,477 | 10,978 | 11,025 | 10,745 | 11,073 |
| 2003 | 11,068 | 8,496 | 10,546 | 8,862 | 9,482 | 9,605 | 9,369 | 9,257 | 9,442 | 10,474 | 10,533 | 10,130 |
| 2004 | 9,946 | 9,103 | 9,538 | 9,031 | 9,901 | 10,035 | 10,588 | 9,918 | 9,550 | 9,444 | 9,700 | 10,264 |
| 2005 | 10,629 | 9,918 | 9,290 | 9,427 | 11,584 | 9,719 | 10,366 | 10,908 | 11,097 | 11,361 | 11,615 | 10,300 |
| 2006 | 11,783 | 9,870 | 10,880 | 11,458 | 11,891 | 11,847 | 11,502 | 12,702 | 11,655 | 11,514 | 11,996 | 11,209 |
| 2007 | 10,996 | 10,542 | 11,832 | 12,866 | 13,194 | 12,727 | 12,456 | 13,071 | 11,540 | 12,095 | 12,993 | 13,024 |
| 2008 | 13,507 | 12,497 | 13,973 | 13,840 | 14,089 | 14,069 | 12,201 | 13,794 | 13,607 | 14,441 | 15,436 | 14,141 |
| 2009 | 14,262 | 12,728 | 15,170 | 14,400 | 15,925 | 15,860 | 16,688 | 16,153 | 15,586 | 16,264 | 16,138 | 17,402 |
| 2010 | 18,976 | 17,048 | 17,836 | 18,005 | 18,014 | 18,077 | 17,469 | 17,893 | 17,711 | 18,409 | 18,239 | 18,582 |
| 2011 | 18,939 | 16,831 | 19,418 | 18,578 | 20,007 | 19,827 | 20,319 | 19,346 | 18,956 | 19,742 | 20,551 | 20,380 |
| 2012 | 21,515 | 20,632 | 21,213 | 19,458 | 21,032 | 20,094 | 21,107 | 21,440 | 20,995 | 21,740 | 20,418 | 19,557 |
| 2013 | 18,940 | 16,066 | 19,719 | 18,324 | 20,603 | 19,240 | 20,357 | 20,322 | 20,985 | 20,968 | 23,181 | 21,343 |
| 2014 | 23,179 | 19,617 | 22,974 | 24,330 | 25,466 | 24,450 | 26,026 | 25,564 | 26,375 | 27,213 | 29,780 | 31,933 |
| 2015 | 32,485 | 29,376 | 36,757 | 33,431 | 36,697 | 35,491 | 36,773 | 33,936 | 35,429 | 37,029 | 35,317 | 36,391 |
| 2016 | 35,225 | 31,901 | 35,369 | 35,992 | 36,274 | 35,346 | 36,834 | 36,152 | 33,558 | 35,074 | 37,072 | 36,049 |
| 2017 | 35,400 | 32,639 | 37,996 | 38,154 | 38,802 | 37,300 | 37,585 | 39,623 | 39,476 | 40,334 | 38,652 | 42,004 |
| 2018 | 41,372 | 37,707 | 43,985 | 42,907 | 44,217 | 40,945 | 41,607 | 43,174 | 43,689 | 45,039 | 46,122 | 49,839 |
| 2019 | 46,683 | 40,888 | 42,346 | 44,328 | 44,636 | 46,810 | 45,428 | 45,604 | 44,274 | 47,520 | 45,410 | 48,719 |
| 2020 | 50,870 | 48,252 | 50,653 | 46,275 | 40,652 | 41,066 | 49,958 | 51,538 | 49,411 | 48,886 | 46,302 | 45,232 |
| 2021 | 48,900 | 43,101 | 47,207 | 47,845 | 53,268 | 52,546 | 53,653 | 53,683 | 51,778 | 56,420 | 54,559 | 57,931 |
| 2022 | 53,718 | 48,681 | 55,635 | 52,348 | 54,598 | 55,586 | 57,115 | 57,012 | 53,988 | 58,335 | 54,476 | 50,773 |
| 2023 | 54,324 | 49,940 | 54,254 | 53,030 | 59,049 | 58,293 | 59,084 | 60,687 | 58,440 | 62,541 | 63,394 | 65,227 |
| 2024 | 58,860 | |||||||||||
| - = No Data Reported; -- = Not Applicable; NA = Not Available; W = Withheld to avoid disclosure of individual company data. |
| Release Date: 3/29/2024 |
| Next Release Date: 4/30/2024 |
Referring Pages: