|
Download Data (XLS File) |
|
||||||||
|
||||||||
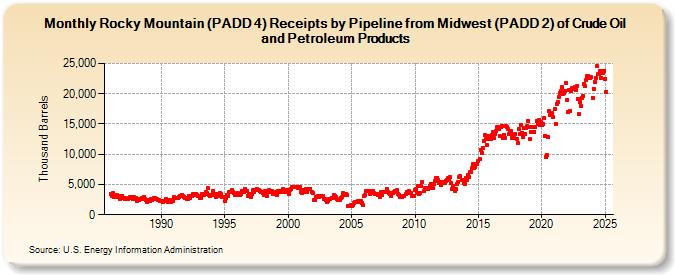
| Rocky Mountain (PADD 4) Receipts by Pipeline from Midwest (PADD 2) of Crude Oil and Petroleum Products (Thousand Barrels) | ||||||||
| Year | Jan | Feb | Mar | Apr | May | Jun | Jul | Aug | Sep | Oct | Nov | Dec |
|---|---|---|---|---|---|---|---|---|---|---|---|---|
| 1986 | 3,379 | 3,153 | 3,541 | 3,002 | 2,931 | 2,986 | 3,280 | 3,140 | 3,039 | 2,590 | 2,896 | 3,134 |
| 1987 | 2,797 | 2,535 | 2,708 | 2,679 | 2,646 | 2,729 | 2,880 | 2,959 | 2,852 | 2,661 | 2,923 | 2,595 |
| 1988 | 2,699 | 2,290 | 2,540 | 2,390 | 2,568 | 2,532 | 2,746 | 2,927 | 2,591 | 2,369 | 2,143 | 2,245 |
| 1989 | 2,400 | 2,333 | 2,526 | 2,451 | 2,583 | 2,792 | 2,707 | 2,582 | 2,544 | 2,372 | 2,398 | 2,323 |
| 1990 | 2,280 | 2,144 | 2,246 | 2,349 | 2,612 | 2,251 | 2,156 | 2,373 | 2,120 | 2,172 | 2,387 | 2,276 |
| 1991 | 2,946 | 2,727 | 2,790 | 2,738 | 2,747 | 2,998 | 3,067 | 3,274 | 3,139 | 3,002 | 2,769 | 2,841 |
| 1992 | 2,629 | 2,605 | 3,168 | 2,722 | 3,024 | 3,114 | 3,420 | 3,320 | 3,450 | 3,484 | 3,216 | 3,084 |
| 1993 | 2,767 | 2,812 | 3,424 | 3,464 | 3,321 | 3,484 | 3,763 | 3,566 | 4,405 | 3,249 | 3,101 | 3,193 |
| 1994 | 3,265 | 3,924 | 3,462 | 3,256 | 2,955 | 3,439 | 3,171 | 3,608 | 3,453 | 2,948 | 2,933 | 2,933 |
| 1995 | 2,224 | 2,728 | 3,306 | 3,108 | 3,788 | 3,705 | 3,719 | 4,013 | 3,698 | 3,529 | 3,312 | 3,343 |
| 1996 | 3,607 | 3,217 | 3,299 | 3,430 | 3,889 | 3,851 | 3,832 | 4,182 | 3,852 | 3,897 | 3,012 | 3,360 |
| 1997 | 3,033 | 2,901 | 3,493 | 4,145 | 3,794 | 4,132 | 4,312 | 4,114 | 4,049 | 3,896 | 3,678 | 3,698 |
| 1998 | 3,657 | 3,221 | 3,911 | 3,463 | 3,165 | 3,990 | 4,108 | 3,774 | 3,673 | 3,909 | 3,438 | 3,567 |
| 1999 | 3,697 | 3,304 | 3,915 | 3,890 | 3,784 | 3,895 | 3,896 | 4,183 | 3,837 | 3,996 | 3,767 | 4,045 |
| 2000 | 3,933 | 3,443 | 4,075 | 4,272 | 4,579 | 4,505 | 4,621 | 4,554 | 4,560 | 4,436 | 4,458 | 4,601 |
| 2001 | 3,817 | 3,603 | 4,011 | 3,809 | 4,120 | 4,189 | 3,776 | 4,330 | 4,265 | 4,297 | 3,802 | 3,593 |
| 2002 | 2,451 | 2,486 | 2,928 | 2,962 | 3,102 | 2,936 | 3,150 | 3,105 | 3,084 | 3,134 | 2,660 | 2,536 |
| 2003 | 2,456 | 2,109 | 2,344 | 2,575 | 2,600 | 2,831 | 2,844 | 3,199 | 3,118 | 2,920 | 2,520 | 2,450 |
| 2004 | 2,410 | 2,489 | 2,793 | 2,900 | 3,601 | 3,372 | 3,305 | 3,389 | 3,236 | 1,401 | 1,506 | 1,530 |
| 2005 | 1,424 | 1,578 | 1,972 | 2,130 | 2,153 | 2,091 | 2,228 | 2,110 | 2,250 | 2,308 | 1,931 | 1,566 |
| 2006 | 3,146 | 3,195 | 3,861 | 3,943 | 3,914 | 3,474 | 3,930 | 3,816 | 3,880 | 3,606 | 3,386 | 3,392 |
| 2007 | 3,426 | 3,221 | 3,234 | 2,943 | 3,797 | 3,331 | 3,730 | 3,781 | 3,813 | 4,224 | 3,807 | 3,619 |
| 2008 | 3,455 | 3,127 | 3,577 | 3,608 | 3,710 | 3,843 | 3,983 | 4,010 | 3,473 | 3,321 | 2,954 | 2,874 |
| 2009 | 2,970 | 3,115 | 3,125 | 3,354 | 3,720 | 3,626 | 3,916 | 3,570 | 3,534 | 3,123 | 3,123 | 3,019 |
| 2010 | 4,092 | 4,200 | 3,570 | 4,738 | 3,475 | 3,618 | 4,698 | 5,382 | 3,844 | 4,351 | 4,319 | 4,414 |
| 2011 | 4,326 | 4,451 | 4,758 | 5,135 | 5,133 | 4,354 | 5,104 | 5,510 | 6,114 | 6,103 | 5,702 | 5,173 |
| 2012 | 5,455 | 4,924 | 5,398 | 5,277 | 5,317 | 5,573 | 5,733 | 6,035 | 5,832 | 6,153 | 5,212 | 4,267 |
| 2013 | 4,717 | 4,284 | 3,975 | 4,275 | 5,054 | 5,452 | 6,294 | 6,399 | 5,665 | 5,769 | 5,250 | 5,076 |
| 2014 | 6,083 | 5,692 | 6,608 | 6,178 | 6,987 | 7,102 | 7,671 | 8,406 | 7,726 | 7,858 | 8,359 | 8,456 |
| 2015 | 8,921 | 9,197 | 10,719 | 10,210 | 11,110 | 12,245 | 13,111 | 12,469 | 11,546 | 12,996 | 12,584 | 12,639 |
| 2016 | 12,467 | 13,110 | 13,619 | 12,613 | 13,423 | 13,849 | 14,557 | 14,095 | 12,943 | 14,453 | 14,724 | 12,603 |
| 2017 | 13,204 | 12,622 | 14,612 | 14,483 | 14,102 | 13,317 | 13,851 | 13,800 | 12,648 | 13,258 | 12,607 | 13,374 |
| 2018 | 12,453 | 11,774 | 14,167 | 13,417 | 14,853 | 13,554 | 12,890 | 14,354 | 13,409 | 14,412 | 14,587 | 15,505 |
| 2019 | 14,490 | 12,448 | 13,655 | 14,418 | 14,446 | 13,715 | 14,461 | 15,520 | 15,018 | 15,656 | 14,804 | 15,337 |
| 2020 | 14,910 | 15,002 | 16,014 | 13,091 | 9,480 | 9,802 | 12,787 | 17,103 | 16,524 | 16,592 | 16,734 | 16,076 |
| 2021 | 17,442 | 15,034 | 18,287 | 18,683 | 19,516 | 20,130 | 20,472 | 21,111 | 20,006 | 20,086 | 20,489 | 21,845 |
| 2022 | 18,993 | 17,048 | 20,543 | 17,225 | 20,479 | 20,885 | 20,791 | 21,106 | 20,607 | 21,217 | 19,185 | 16,632 |
| 2023 | 18,641 | 17,969 | 19,352 | 19,650 | 21,585 | 21,224 | 22,203 | 22,887 | 22,967 | 22,626 | 22,667 | 22,688 |
| 2024 | 19,348 | 20,851 | 21,985 | 22,519 | ||||||||
| - = No Data Reported; -- = Not Applicable; NA = Not Available; W = Withheld to avoid disclosure of individual company data. |
| Release Date: 6/28/2024 |
| Next Release Date: 7/31/2024 |