|
Download Data (XLS File) |
|
||||||||
|
||||||||
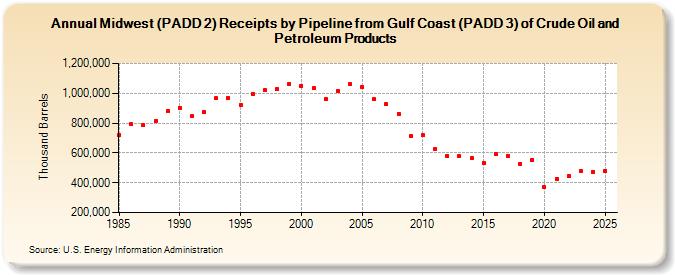
| Midwest (PADD 2) Receipts by Pipeline from Gulf Coast (PADD 3) of Crude Oil and Petroleum Products (Thousand Barrels) | ||||||||
| Decade | Year-0 | Year-1 | Year-2 | Year-3 | Year-4 | Year-5 | Year-6 | Year-7 | Year-8 | Year-9 |
|---|---|---|---|---|---|---|---|---|---|---|
| 1980's | 721,015 | 793,273 | 785,585 | 816,314 | 879,595 | |||||
| 1990's | 903,462 | 845,264 | 873,433 | 966,524 | 969,151 | 923,802 | 997,312 | 1,019,745 | 1,025,640 | 1,061,112 |
| 2000's | 1,050,991 | 1,035,417 | 961,394 | 1,018,345 | 1,059,461 | 1,040,163 | 959,336 | 925,134 | 863,690 | 710,305 |
| 2010's | 717,379 | 624,555 | 579,334 | 578,748 | 565,669 | 532,646 | 592,986 | 576,306 | 527,772 | 555,008 |
| 2020's | 368,663 | 427,037 | 446,004 | 482,031 |
| - = No Data Reported; -- = Not Applicable; NA = Not Available; W = Withheld to avoid disclosure of individual company data. |
| Release Date: 8/30/2024 |
| Next Release Date: 8/29/2025 |