|
Download Data (XLS File) |
|
||||||||
|
||||||||
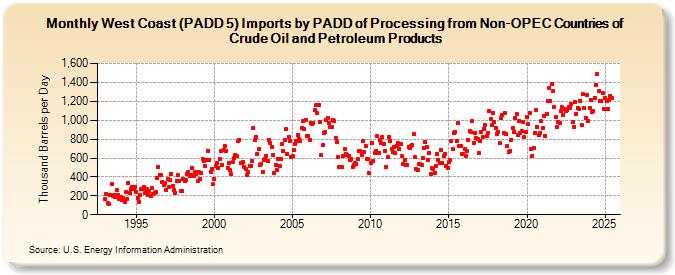
| West Coast (PADD 5) Imports by PADD of Processing from Non-OPEC Countries of Crude Oil and Petroleum Products (Thousand Barrels per Day) | ||||||||
| Year | Jan | Feb | Mar | Apr | May | Jun | Jul | Aug | Sep | Oct | Nov | Dec |
|---|---|---|---|---|---|---|---|---|---|---|---|---|
| 1993 | 161 | 224 | 121 | 112 | 212 | 323 | 195 | 210 | 184 | 264 | 209 | 169 |
| 1994 | 190 | 158 | 180 | 136 | 237 | 163 | 338 | 232 | 271 | 288 | 270 | 298 |
| 1995 | 245 | 178 | 135 | 209 | 275 | 268 | 291 | 233 | 269 | 204 | 254 | 199 |
| 1996 | 281 | 216 | 234 | 240 | 389 | 504 | 422 | 423 | 350 | 314 | 334 | 262 |
| 1997 | 379 | 292 | 372 | 431 | 307 | 257 | 232 | 358 | 418 | 360 | 247 | 250 |
| 1998 | 381 | 358 | 364 | 434 | 455 | 406 | 423 | 499 | 412 | 454 | 434 | 353 |
| 1999 | 448 | 382 | 441 | 593 | 566 | 511 | 575 | 677 | 580 | 457 | 483 | 322 |
| 2000 | 374 | 514 | 544 | 495 | 589 | 677 | 530 | 687 | 723 | 675 | 494 | 546 |
| 2001 | 468 | 428 | 557 | 596 | 629 | 616 | 778 | 789 | 546 | 546 | 559 | 500 |
| 2002 | 483 | 420 | 448 | 520 | 517 | 564 | 921 | 788 | 824 | 644 | 697 | 521 |
| 2003 | 539 | 449 | 583 | 585 | 624 | 564 | 795 | 757 | 721 | 629 | 446 | 523 |
| 2004 | 472 | 587 | 518 | 594 | 747 | 677 | 786 | 902 | 645 | 825 | 778 | 613 |
| 2005 | 618 | 682 | 750 | 780 | 846 | 802 | 781 | 913 | 995 | 906 | 1,007 | 838 |
| 2006 | 833 | 790 | 974 | 960 | 973 | 1,103 | 1,156 | 1,075 | 1,164 | 976 | 631 | 739 |
| 2007 | 867 | 874 | 998 | 1,025 | 975 | 932 | 923 | 1,007 | 990 | 810 | 765 | 606 |
| 2008 | 510 | 500 | 501 | 621 | 692 | 646 | 635 | 620 | 574 | 589 | 509 | 522 |
| 2009 | 542 | 539 | 585 | 669 | 669 | 635 | 779 | 665 | 726 | 593 | 588 | 438 |
| 2010 | 550 | 763 | 566 | 648 | 677 | 832 | 657 | 787 | 763 | 817 | 746 | 679 |
| 2011 | 507 | 608 | 822 | 775 | 693 | 659 | 714 | 648 | 723 | 754 | 694 | 749 |
| 2012 | 616 | 541 | 579 | 530 | 521 | 718 | 701 | 727 | 737 | 850 | 607 | 483 |
| 2013 | 471 | 532 | 539 | 525 | 600 | 704 | 765 | 721 | 581 | 658 | 430 | 490 |
| 2014 | 488 | 446 | 520 | 639 | 575 | 547 | 689 | 545 | 623 | 640 | 520 | 492 |
| 2015 | 554 | 579 | 780 | 694 | 864 | 873 | 776 | 971 | 731 | 730 | 645 | 644 |
| 2016 | 690 | 623 | 670 | 786 | 886 | 870 | 988 | 763 | 862 | 810 | 801 | 656 |
| 2017 | 780 | 878 | 821 | 908 | 949 | 837 | 867 | 1,095 | 1,016 | 944 | 1,081 | 980 |
| 2018 | 922 | 853 | 879 | 754 | 1,019 | 1,052 | 864 | 1,077 | 853 | 727 | 660 | 675 |
| 2019 | 794 | 919 | 871 | 1,026 | 1,069 | 846 | 987 | 864 | 883 | 983 | 818 | 880 |
| 2020 | 1,031 | 955 | 1,078 | 691 | 626 | 707 | 861 | 1,110 | 932 | 847 | 866 | 990 |
| 2021 | 913 | 1,049 | 835 | 1,070 | 1,199 | 1,339 | 1,206 | 1,383 | 1,307 | 1,139 | 1,032 | 926 |
| 2022 | 984 | 967 | 1,102 | 1,135 | 1,058 | 1,121 | 1,101 | 1,107 | 1,135 | 1,134 | 1,169 | 978 |
| 2023 | 940 | 1,189 | 1,071 | 1,125 | 1,119 | 1,208 | 942 | 1,273 | 1,133 | 1,023 | 1,262 | 995 |
| 2024 | 1,146 | |||||||||||
| - = No Data Reported; -- = Not Applicable; NA = Not Available; W = Withheld to avoid disclosure of individual company data. |
| Release Date: 3/29/2024 |
| Next Release Date: 4/30/2024 |