|
Download Data (XLS File) |
|
||||||||
|
||||||||
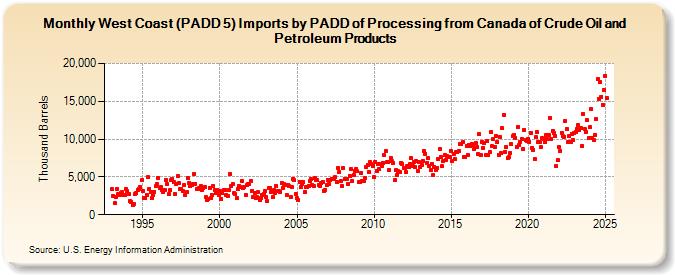
| West Coast (PADD 5) Imports by PADD of Processing from Canada of Crude Oil and Petroleum Products (Thousand Barrels) | ||||||||
| Year | Jan | Feb | Mar | Apr | May | Jun | Jul | Aug | Sep | Oct | Nov | Dec |
|---|---|---|---|---|---|---|---|---|---|---|---|---|
| 1993 | 3,353 | 2,477 | 1,534 | 2,285 | 3,417 | 2,701 | 2,579 | 2,917 | 2,942 | 2,660 | 2,650 | 3,374 |
| 1994 | 3,073 | 2,789 | 1,812 | 1,701 | 1,285 | 1,426 | 2,719 | 2,835 | 3,329 | 3,401 | 3,612 | 4,539 |
| 1995 | 3,190 | 2,176 | 2,199 | 2,662 | 4,953 | 3,439 | 3,070 | 2,209 | 2,579 | 3,054 | 3,758 | 4,061 |
| 1996 | 4,871 | 3,509 | 3,648 | 3,211 | 2,972 | 3,282 | 4,526 | 4,039 | 2,697 | 3,234 | 4,557 | 4,723 |
| 1997 | 4,267 | 2,741 | 4,027 | 5,103 | 4,205 | 3,337 | 3,413 | 3,073 | 3,880 | 2,570 | 2,977 | 4,853 |
| 1998 | 4,186 | 3,752 | 3,881 | 4,107 | 5,392 | 4,117 | 3,421 | 3,436 | 3,478 | 3,771 | 3,268 | 3,489 |
| 1999 | 3,666 | 2,351 | 1,982 | 2,064 | 3,539 | 2,215 | 2,673 | 3,779 | 3,289 | 2,885 | 3,288 | 2,565 |
| 2000 | 3,113 | 2,099 | 2,871 | 3,282 | 3,307 | 2,588 | 2,527 | 3,273 | 5,377 | 3,817 | 4,011 | 2,852 |
| 2001 | 2,678 | 2,235 | 3,338 | 3,828 | 3,680 | 4,520 | 3,490 | 3,672 | 2,666 | 3,913 | 4,116 | 4,124 |
| 2002 | 4,490 | 3,191 | 2,331 | 2,904 | 2,174 | 2,293 | 2,952 | 1,914 | 2,265 | 2,571 | 2,785 | 3,089 |
| 2003 | 2,360 | 1,798 | 3,523 | 3,470 | 3,001 | 2,285 | 3,257 | 2,850 | 3,743 | 3,153 | 3,092 | 3,054 |
| 2004 | 4,213 | 3,484 | 4,087 | 3,960 | 2,647 | 3,971 | 3,779 | 2,307 | 3,705 | 4,734 | 4,537 | 2,786 |
| 2005 | 2,205 | 1,896 | 4,350 | 3,651 | 4,084 | 4,316 | 3,012 | 3,690 | 3,640 | 3,786 | 4,523 | 4,741 |
| 2006 | 3,922 | 3,844 | 4,828 | 4,566 | 4,585 | 3,959 | 3,860 | 4,148 | 4,355 | 3,109 | 3,306 | 3,870 |
| 2007 | 4,651 | 4,082 | 4,590 | 4,762 | 4,760 | 4,776 | 4,945 | 4,298 | 6,169 | 5,617 | 4,476 | 3,848 |
| 2008 | 6,177 | 4,752 | 4,729 | 4,761 | 4,120 | 5,130 | 6,027 | 4,443 | 5,239 | 5,842 | 6,063 | 5,722 |
| 2009 | 4,317 | 4,346 | 5,526 | 4,519 | 4,475 | 4,897 | 6,350 | 6,588 | 5,702 | 6,932 | 6,695 | 6,389 |
| 2010 | 4,931 | 7,007 | 5,774 | 6,649 | 6,004 | 6,652 | 6,496 | 6,889 | 7,859 | 8,369 | 6,913 | 7,000 |
| 2011 | 5,963 | 7,532 | 7,067 | 6,817 | 4,540 | 5,867 | 5,235 | 5,729 | 5,631 | 6,869 | 6,719 | 6,236 |
| 2012 | 6,229 | 5,619 | 6,427 | 6,256 | 6,681 | 7,444 | 6,401 | 6,999 | 6,306 | 7,099 | 5,827 | 6,908 |
| 2013 | 6,351 | 6,525 | 7,126 | 8,390 | 8,083 | 6,869 | 7,478 | 6,437 | 5,931 | 6,676 | 5,187 | 6,321 |
| 2014 | 5,958 | 6,241 | 7,393 | 8,648 | 7,622 | 6,379 | 7,067 | 7,936 | 7,244 | 7,826 | 7,570 | 7,611 |
| 2015 | 8,393 | 7,093 | 8,034 | 7,336 | 8,258 | 8,357 | 8,422 | 9,329 | 9,349 | 9,582 | 7,586 | 7,573 |
| 2016 | 9,090 | 7,950 | 9,255 | 9,023 | 9,367 | 9,207 | 8,756 | 9,514 | 8,947 | 8,023 | 10,645 | 7,835 |
| 2017 | 9,656 | 8,856 | 9,476 | 7,861 | 9,787 | 7,912 | 8,253 | 10,913 | 9,040 | 10,060 | 9,000 | 10,447 |
| 2018 | 9,592 | 7,906 | 10,304 | 8,127 | 11,421 | 13,208 | 8,331 | 9,008 | 7,485 | 7,637 | 8,156 | 9,308 |
| 2019 | 10,350 | 10,525 | 10,203 | 9,012 | 11,605 | 9,171 | 9,584 | 10,032 | 8,742 | 11,265 | 9,869 | 9,789 |
| 2020 | 10,070 | 9,613 | 10,836 | 8,843 | 8,607 | 7,326 | 10,219 | 10,904 | 9,666 | 9,589 | 8,902 | 10,126 |
| 2021 | 9,956 | 9,626 | 10,541 | 9,964 | 10,482 | 12,838 | 10,056 | 11,122 | 10,863 | 10,433 | 6,398 | 7,192 |
| 2022 | 8,930 | 8,452 | 10,869 | 10,345 | 10,330 | 12,376 | 11,314 | 9,555 | 10,358 | 9,638 | 10,732 | 9,858 |
| 2023 | 10,817 | 10,944 | 11,392 | 11,837 | 11,164 | 11,412 | 9,146 | 13,321 | 11,325 | 10,916 | 12,484 | 10,091 |
| 2024 | 11,555 | 13,962 | 10,080 | 9,934 | 10,551 | 12,610 | ||||||
| - = No Data Reported; -- = Not Applicable; NA = Not Available; W = Withheld to avoid disclosure of individual company data. |
| Release Date: 8/30/2024 |
| Next Release Date: 9/30/2024 |