|
Download Data (XLS File) |
|
||||||||
|
||||||||
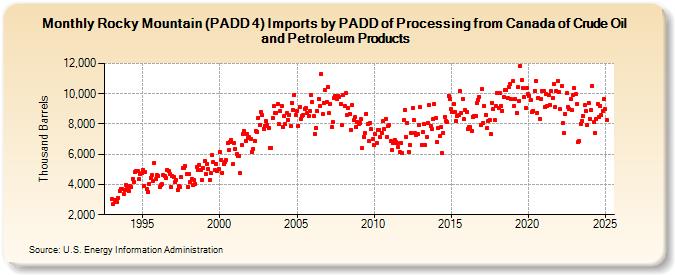
| Rocky Mountain (PADD 4) Imports by PADD of Processing from Canada of Crude Oil and Petroleum Products (Thousand Barrels) | ||||||||
| Year | Jan | Feb | Mar | Apr | May | Jun | Jul | Aug | Sep | Oct | Nov | Dec |
|---|---|---|---|---|---|---|---|---|---|---|---|---|
| 1993 | 3,019 | 2,717 | 2,978 | 2,823 | 2,828 | 3,133 | 3,561 | 3,717 | 3,670 | 3,357 | 3,611 | 3,967 |
| 1994 | 3,781 | 3,553 | 3,898 | 3,805 | 4,380 | 4,150 | 4,838 | 4,865 | 4,883 | 4,335 | 4,668 | 4,733 |
| 1995 | 4,964 | 3,900 | 4,798 | 3,681 | 3,489 | 4,058 | 4,436 | 4,601 | 4,258 | 5,438 | 4,331 | 4,610 |
| 1996 | 4,585 | 3,864 | 3,940 | 4,012 | 4,629 | 4,549 | 4,446 | 4,984 | 4,867 | 4,685 | 3,810 | 4,586 |
| 1997 | 4,507 | 4,154 | 4,269 | 3,623 | 3,893 | 3,820 | 4,505 | 5,072 | 5,083 | 5,218 | 4,665 | 3,856 |
| 1998 | 4,669 | 4,149 | 4,391 | 3,938 | 4,287 | 4,037 | 5,187 | 4,976 | 5,295 | 4,985 | 4,296 | 5,112 |
| 1999 | 5,536 | 4,721 | 5,371 | 5,018 | 4,296 | 4,754 | 5,925 | 5,458 | 4,936 | 5,363 | 4,920 | 5,025 |
| 2000 | 6,144 | 5,648 | 4,790 | 5,352 | 5,513 | 5,634 | 6,715 | 6,256 | 6,783 | 6,964 | 5,332 | 6,726 |
| 2001 | 6,366 | 5,984 | 5,888 | 5,910 | 4,745 | 6,606 | 7,347 | 7,519 | 6,888 | 7,325 | 7,069 | 7,115 |
| 2002 | 7,010 | 6,148 | 6,346 | 6,865 | 7,560 | 7,477 | 8,426 | 7,943 | 8,779 | 8,566 | 7,700 | 7,887 |
| 2003 | 8,166 | 7,951 | 7,766 | 6,436 | 6,416 | 8,399 | 9,160 | 8,732 | 8,754 | 9,332 | 7,996 | 8,867 |
| 2004 | 9,214 | 7,824 | 8,497 | 8,013 | 8,717 | 8,290 | 8,604 | 7,862 | 9,414 | 8,954 | 9,945 | 8,625 |
| 2005 | 8,880 | 7,873 | 9,099 | 8,359 | 8,544 | 8,597 | 9,016 | 9,041 | 8,752 | 8,498 | 8,846 | 9,892 |
| 2006 | 9,459 | 8,497 | 7,350 | 7,763 | 8,867 | 9,661 | 9,187 | 11,289 | 8,646 | 9,389 | 10,275 | 9,449 |
| 2007 | 10,420 | 8,709 | 9,346 | 7,789 | 8,111 | 9,695 | 9,822 | 9,667 | 9,826 | 9,815 | 9,328 | 7,916 |
| 2008 | 9,936 | 9,212 | 10,024 | 8,576 | 9,025 | 8,673 | 7,602 | 9,270 | 8,236 | 8,429 | 7,776 | 8,145 |
| 2009 | 7,995 | 8,050 | 8,317 | 6,389 | 7,123 | 7,404 | 8,687 | 7,966 | 6,861 | 8,096 | 7,641 | 6,978 |
| 2010 | 6,612 | 7,310 | 6,735 | 7,604 | 7,631 | 7,124 | 7,425 | 8,180 | 7,658 | 8,334 | 7,167 | 7,835 |
| 2011 | 7,950 | 6,879 | 6,303 | 6,723 | 6,955 | 6,840 | 6,714 | 6,468 | 6,145 | 6,753 | 6,084 | 8,254 |
| 2012 | 8,946 | 7,159 | 8,092 | 6,176 | 6,617 | 7,423 | 9,068 | 8,262 | 7,381 | 7,272 | 7,344 | 7,922 |
| 2013 | 9,098 | 6,612 | 7,477 | 7,969 | 6,582 | 7,140 | 8,060 | 9,234 | 7,857 | 7,637 | 8,303 | 9,330 |
| 2014 | 8,382 | 6,799 | 7,730 | 7,195 | 7,780 | 6,057 | 7,434 | 8,488 | 8,206 | 8,106 | 9,882 | 9,666 |
| 2015 | 8,960 | 8,805 | 9,352 | 8,818 | 8,180 | 8,510 | 8,573 | 10,171 | 8,731 | 9,683 | 8,310 | 8,931 |
| 2016 | 8,808 | 7,687 | 7,801 | 7,781 | 7,536 | 8,491 | 8,515 | 8,511 | 9,362 | 9,590 | 9,793 | 7,946 |
| 2017 | 10,328 | 8,097 | 9,195 | 8,614 | 7,702 | 8,194 | 8,264 | 7,338 | 9,413 | 8,971 | 8,243 | 9,177 |
| 2018 | 10,075 | 9,078 | 10,024 | 9,174 | 8,890 | 9,770 | 10,228 | 10,229 | 9,697 | 10,412 | 10,616 | 9,630 |
| 2019 | 10,830 | 9,177 | 9,641 | 8,749 | 10,433 | 9,530 | 11,840 | 10,904 | 10,379 | 9,756 | 9,079 | 10,376 |
| 2020 | 10,001 | 9,847 | 9,573 | 8,812 | 8,882 | 10,199 | 10,862 | 8,753 | 9,733 | 8,356 | 9,647 | 10,211 |
| 2021 | 10,204 | 9,090 | 9,983 | 9,190 | 9,899 | 9,259 | 10,179 | 9,719 | 10,628 | 9,124 | 10,212 | 10,860 |
| 2022 | 10,105 | 8,973 | 10,495 | 8,082 | 7,378 | 8,669 | 10,029 | 9,098 | 9,006 | 9,649 | 8,899 | 9,904 |
| 2023 | 10,315 | 9,749 | 9,329 | 6,787 | 7,182 | 7,691 | 7,866 | 8,982 | 7,702 | 9,085 | 8,228 | 9,369 |
| 2024 | 8,339 | |||||||||||
| - = No Data Reported; -- = Not Applicable; NA = Not Available; W = Withheld to avoid disclosure of individual company data. |
| Release Date: 3/29/2024 |
| Next Release Date: 4/30/2024 |