|
Download Data (XLS File) |
|
||||||||
|
||||||||
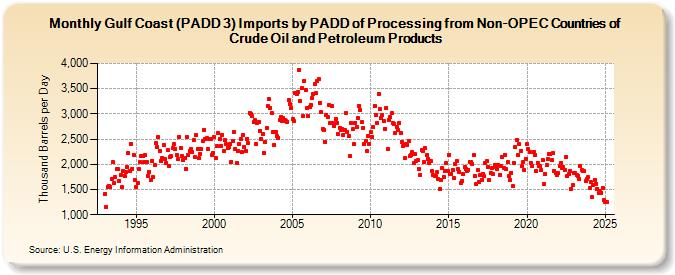
| Gulf Coast (PADD 3) Imports by PADD of Processing from Non-OPEC Countries of Crude Oil and Petroleum Products (Thousand Barrels per Day) | ||||||||
| Year | Jan | Feb | Mar | Apr | May | Jun | Jul | Aug | Sep | Oct | Nov | Dec |
|---|---|---|---|---|---|---|---|---|---|---|---|---|
| 1993 | 1,414 | 1,162 | 1,557 | 1,562 | 1,553 | 1,707 | 2,040 | 1,620 | 1,749 | 1,908 | 1,904 | 1,670 |
| 1994 | 1,790 | 1,543 | 1,859 | 1,777 | 1,844 | 1,942 | 2,215 | 1,871 | 2,412 | 1,916 | 2,183 | 1,686 |
| 1995 | 1,550 | 1,621 | 1,904 | 2,038 | 2,160 | 2,166 | 2,041 | 2,183 | 2,038 | 1,777 | 1,857 | 1,689 |
| 1996 | 2,071 | 1,747 | 1,993 | 2,421 | 2,347 | 2,532 | 2,262 | 2,069 | 2,122 | 2,389 | 2,108 | 2,030 |
| 1997 | 2,279 | 1,968 | 2,148 | 2,163 | 2,324 | 2,394 | 2,308 | 2,180 | 2,100 | 2,547 | 2,330 | 2,163 |
| 1998 | 2,078 | 2,130 | 1,915 | 2,542 | 2,194 | 2,268 | 2,294 | 2,252 | 2,474 | 2,142 | 2,582 | 2,298 |
| 1999 | 2,116 | 2,209 | 2,295 | 2,461 | 2,679 | 2,500 | 2,513 | 2,307 | 2,504 | 2,497 | 2,194 | 2,224 |
| 2000 | 2,540 | 2,123 | 2,355 | 2,620 | 2,504 | 2,371 | 2,590 | 2,268 | 2,477 | 2,395 | 2,330 | 2,350 |
| 2001 | 2,393 | 2,050 | 2,457 | 2,650 | 2,304 | 2,034 | 2,260 | 2,410 | 2,493 | 2,236 | 2,579 | 2,345 |
| 2002 | 2,270 | 2,503 | 2,418 | 3,026 | 2,994 | 2,953 | 2,834 | 2,869 | 2,399 | 2,829 | 2,846 | 2,670 |
| 2003 | 2,510 | 2,608 | 2,230 | 2,445 | 2,726 | 3,150 | 3,296 | 3,110 | 3,021 | 2,634 | 2,376 | 2,638 |
| 2004 | 2,560 | 2,527 | 2,869 | 2,944 | 2,850 | 2,916 | 2,885 | 2,866 | 2,849 | 3,268 | 3,204 | 3,124 |
| 2005 | 2,903 | 2,855 | 3,418 | 3,394 | 3,439 | 3,867 | 3,250 | 3,506 | 2,949 | 3,661 | 3,480 | 3,111 |
| 2006 | 2,954 | 3,136 | 3,182 | 3,312 | 3,387 | 3,591 | 3,406 | 3,652 | 3,686 | 3,223 | 3,037 | 2,696 |
| 2007 | 2,690 | 2,449 | 2,984 | 2,941 | 3,181 | 2,819 | 3,148 | 2,812 | 2,757 | 2,906 | 2,828 | 2,598 |
| 2008 | 2,721 | 2,673 | 2,706 | 2,591 | 2,672 | 3,018 | 2,637 | 2,568 | 2,161 | 2,820 | 2,693 | 2,397 |
| 2009 | 2,828 | 2,743 | 2,920 | 3,165 | 3,077 | 2,834 | 2,721 | 2,398 | 2,460 | 2,260 | 2,560 | 2,404 |
| 2010 | 2,633 | 2,532 | 2,735 | 3,154 | 2,977 | 2,820 | 3,403 | 3,090 | 2,914 | 2,970 | 2,857 | 2,709 |
| 2011 | 3,123 | 2,294 | 2,879 | 2,934 | 3,014 | 2,810 | 2,806 | 2,626 | 2,737 | 2,677 | 2,818 | 2,623 |
| 2012 | 2,448 | 2,361 | 2,116 | 2,409 | 2,392 | 2,469 | 2,174 | 2,189 | 2,238 | 2,017 | 2,207 | 2,073 |
| 2013 | 2,080 | 1,901 | 1,795 | 2,279 | 2,260 | 2,049 | 2,315 | 2,185 | 2,099 | 2,016 | 2,066 | 1,859 |
| 2014 | 1,783 | 1,774 | 1,770 | 1,838 | 1,713 | 1,507 | 1,694 | 1,920 | 1,758 | 1,875 | 2,024 | 1,863 |
| 2015 | 2,189 | 1,808 | 1,811 | 1,894 | 1,723 | 2,006 | 2,059 | 1,897 | 1,843 | 1,625 | 1,666 | 1,801 |
| 2016 | 1,946 | 1,906 | 1,871 | 1,893 | 2,053 | 2,054 | 2,008 | 2,182 | 1,767 | 1,601 | 1,882 | 1,652 |
| 2017 | 1,782 | 1,684 | 1,816 | 1,767 | 2,023 | 2,056 | 1,951 | 1,688 | 1,835 | 1,921 | 1,812 | 1,990 |
| 2018 | 1,951 | 1,915 | 1,995 | 1,797 | 1,967 | 2,139 | 1,935 | 2,187 | 1,905 | 2,040 | 1,760 | 1,680 |
| 2019 | 1,836 | 1,563 | 2,032 | 2,337 | 2,485 | 2,178 | 2,394 | 2,262 | 1,962 | 2,044 | 1,884 | 2,113 |
| 2020 | 2,393 | 2,297 | 2,246 | 2,024 | 1,970 | 2,242 | 2,193 | 1,865 | 2,034 | 1,969 | 1,957 | 1,880 |
| 2021 | 2,085 | 1,604 | 1,813 | 1,984 | 2,097 | 2,205 | 2,209 | 2,083 | 2,218 | 1,867 | 1,821 | 1,780 |
| 2022 | 1,823 | 1,963 | 2,034 | 1,934 | 1,937 | 1,889 | 2,140 | 1,762 | 1,813 | 1,875 | 1,519 | 1,583 |
| 2023 | 1,616 | 1,560 | 1,601 | 1,594 | 1,624 | 1,850 | 1,769 | 1,673 | 1,693 | 1,534 | 1,669 | 1,709 |
| 2024 | 1,523 | |||||||||||
| - = No Data Reported; -- = Not Applicable; NA = Not Available; W = Withheld to avoid disclosure of individual company data. |
| Release Date: 3/29/2024 |
| Next Release Date: 4/30/2024 |