|
Download Data (XLS File) |
|
||||||||
|
||||||||
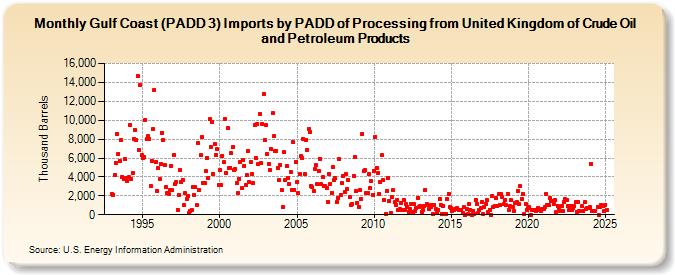
| Gulf Coast (PADD 3) Imports by PADD of Processing from United Kingdom of Crude Oil and Petroleum Products (Thousand Barrels) | ||||||||
| Year | Jan | Feb | Mar | Apr | May | Jun | Jul | Aug | Sep | Oct | Nov | Dec |
|---|---|---|---|---|---|---|---|---|---|---|---|---|
| 1993 | 2,179 | 2,138 | 4,212 | 5,519 | 8,528 | 6,470 | 5,730 | 7,898 | 4,011 | 3,826 | 5,875 | 3,937 |
| 1994 | 3,525 | 3,962 | 9,538 | 3,797 | 4,457 | 8,034 | 8,989 | 7,893 | 14,707 | 6,861 | 13,714 | 6,296 |
| 1995 | 5,948 | 6,089 | 10,040 | 7,994 | 8,291 | 7,979 | 3,062 | 5,724 | 9,046 | 13,240 | 5,529 | 2,557 |
| 1996 | 4,939 | 3,733 | 5,356 | 8,696 | 7,952 | 5,207 | 2,944 | 2,345 | 2,192 | 2,637 | 5,202 | 2,569 |
| 1997 | 6,351 | 3,241 | 3,488 | 526 | 2,047 | 4,749 | 3,425 | 3,721 | 998 | 2,269 | 1,672 | 1,982 |
| 1998 | 187 | 411 | 513 | 2,889 | 2,128 | 2,902 | 1,014 | 7,608 | 2,666 | 6,304 | 8,231 | 3,394 |
| 1999 | 3,358 | 4,615 | 6,010 | 3,891 | 10,094 | 7,211 | 9,774 | 4,292 | 7,475 | 6,358 | 6,921 | 3,127 |
| 2000 | 4,736 | 3,149 | 6,251 | 5,534 | 10,111 | 4,420 | 9,129 | 4,915 | 4,986 | 6,493 | 7,159 | 4,688 |
| 2001 | 4,798 | 3,310 | 2,288 | 3,806 | 5,571 | 2,776 | 5,827 | 5,172 | 3,126 | 4,203 | 6,693 | 3,478 |
| 2002 | 5,544 | 4,318 | 3,339 | 9,489 | 6,006 | 9,626 | 5,370 | 10,668 | 5,456 | 9,634 | 12,738 | 7,890 |
| 2003 | 9,489 | 6,405 | 5,411 | 4,716 | 7,004 | 10,719 | 8,285 | 6,700 | 6,750 | 4,944 | 3,638 | 5,278 |
| 2004 | 2,631 | 775 | 6,586 | 3,662 | 5,152 | 3,872 | 3,271 | 4,529 | 2,657 | 7,665 | 2,636 | 5,628 |
| 2005 | 3,423 | 2,310 | 4,296 | 6,174 | 5,959 | 8,011 | 4,259 | 7,925 | 6,876 | 9,053 | 8,788 | 3,068 |
| 2006 | 2,887 | 2,494 | 4,830 | 5,220 | 3,214 | 4,599 | 5,947 | 3,211 | 3,967 | 3,017 | 2,994 | 2,831 |
| 2007 | 1,372 | 4,324 | 3,276 | 2,273 | 5,003 | 3,678 | 3,843 | 1,321 | 1,796 | 5,902 | 2,125 | 3,315 |
| 2008 | 4,069 | 2,407 | 4,275 | 2,723 | 3,715 | 1,920 | 1,005 | 1,159 | 4,119 | 6,144 | 2,471 | 1,278 |
| 2009 | 828 | 2,628 | 1,671 | 8,542 | 4,589 | 4,685 | 2,343 | 2,306 | 4,298 | 2,829 | 3,534 | 2,118 |
| 2010 | 4,639 | 8,261 | 4,960 | 4,369 | 2,228 | 3,422 | 6,274 | 3,684 | 1,580 | 86 | 2,550 | 3,861 |
| 2011 | 1,445 | 208 | 1,854 | 2,570 | 1,303 | 1,068 | 1,554 | 509 | 599 | 1,278 | 546 | 1,554 |
| 2012 | 518 | 1,104 | 825 | 318 | 588 | 1,101 | 293 | 1,105 | 347 | 709 | 1,818 | 863 |
| 2013 | 954 | 335 | 535 | 944 | 2,635 | 1,139 | 1,075 | 572 | 820 | 1,070 | 111 | 1,041 |
| 2014 | 605 | 190 | 549 | 1,675 | 1,077 | 89 | 917 | 74 | 102 | 1,621 | 2,207 | 805 |
| 2015 | 668 | 445 | 514 | 574 | 626 | 692 | 485 | 508 | 519 | 189 | 791 | 13 |
| 2016 | 567 | 28 | 1,088 | 534 | 11 | 379 | 102 | 1,576 | 1,166 | 150 | 521 | 719 |
| 2017 | 1,369 | 49 | 869 | 1,169 | 1,514 | 257 | 546 | 9 | 1,973 | 840 | 895 | 1,757 |
| 2018 | 940 | 2,140 | 1,034 | 2,181 | 1,837 | 1,123 | 1,515 | 975 | 2,204 | 499 | 900 | 1,506 |
| 2019 | 831 | 406 | 1,271 | 1,349 | 2,534 | 1,104 | 3,034 | 1,648 | 2,210 | 23 | 1,128 | 532 |
| 2020 | 698 | 806 | 18 | 537 | 454 | 475 | 438 | 741 | 501 | 423 | 625 | |
| 2021 | 657 | 802 | 2,166 | 1,068 | 1,011 | 1,786 | 1,447 | 1,406 | 1,122 | 1,558 | 249 | 943 |
| 2022 | 630 | 409 | 924 | 425 | 1,352 | 1,627 | 1,547 | 902 | 447 | 916 | 481 | 665 |
| 2023 | 915 | 1,317 | 332 | 1,355 | 419 | 875 | 412 | 1,301 | 556 | 673 | 710 | |
| 2024 | 805 | |||||||||||
| - = No Data Reported; -- = Not Applicable; NA = Not Available; W = Withheld to avoid disclosure of individual company data. |
| Release Date: 3/29/2024 |
| Next Release Date: 4/30/2024 |