|
Download Data (XLS File) |
|
||||||||
|
||||||||
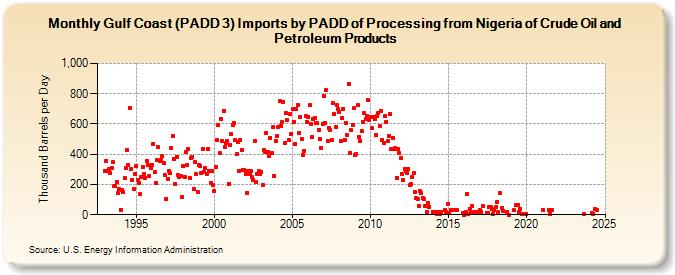
| Gulf Coast (PADD 3) Imports by PADD of Processing from Nigeria of Crude Oil and Petroleum Products (Thousand Barrels per Day) | ||||||||
| Year | Jan | Feb | Mar | Apr | May | Jun | Jul | Aug | Sep | Oct | Nov | Dec |
|---|---|---|---|---|---|---|---|---|---|---|---|---|
| 1993 | 291 | 358 | 288 | 302 | 277 | 308 | 349 | 188 | 189 | 216 | 142 | 167 |
| 1994 | 33 | 161 | 148 | 244 | 308 | 426 | 331 | 707 | 304 | 230 | 170 | 270 |
| 1995 | 322 | 232 | 212 | 135 | 252 | 313 | 272 | 241 | 357 | 328 | 255 | 309 |
| 1996 | 328 | 470 | 280 | 211 | 363 | 450 | 354 | 359 | 388 | 339 | 262 | 107 |
| 1997 | 238 | 292 | 275 | 444 | 520 | 370 | 203 | 384 | 260 | 252 | 253 | 115 |
| 1998 | 322 | 251 | 416 | 326 | 433 | 246 | 372 | 383 | 167 | 350 | 269 | 153 |
| 1999 | 332 | 324 | 274 | 437 | 282 | 307 | 270 | 435 | 287 | 211 | 291 | 199 |
| 2000 | 159 | 317 | 493 | 593 | 406 | 636 | 485 | 688 | 446 | 471 | 488 | 204 |
| 2001 | 464 | 531 | 595 | 609 | 495 | 399 | 478 | 289 | 495 | 431 | 297 | 295 |
| 2002 | 272 | 146 | 288 | 271 | 289 | 247 | 232 | 486 | 215 | 267 | 291 | 268 |
| 2003 | 283 | 198 | 431 | 417 | 542 | 415 | 390 | 509 | 408 | 577 | 259 | 490 |
| 2004 | 522 | 577 | 750 | 587 | 613 | 748 | 473 | 673 | 623 | 492 | 666 | 531 |
| 2005 | 697 | 615 | 468 | 696 | 727 | 539 | 646 | 503 | 397 | 424 | 652 | 614 |
| 2006 | 647 | 727 | 603 | 515 | 633 | 642 | 604 | 608 | 563 | 500 | 440 | 600 |
| 2007 | 786 | 604 | 822 | 486 | 575 | 557 | 494 | 736 | 667 | 583 | 726 | 700 |
| 2008 | 679 | 490 | 642 | 698 | 493 | 607 | 524 | 866 | 411 | 560 | 596 | 704 |
| 2009 | 395 | 404 | 726 | 516 | 488 | 554 | 612 | 671 | 631 | 652 | 756 | 629 |
| 2010 | 643 | 571 | 647 | 631 | 526 | 656 | 674 | 585 | 689 | 496 | 477 | 651 |
| 2011 | 612 | 485 | 518 | 666 | 434 | 508 | 432 | 442 | 245 | 437 | 408 | 375 |
| 2012 | 271 | 229 | 300 | 292 | 276 | 303 | 196 | 200 | 249 | 274 | 150 | 109 |
| 2013 | 107 | 57 | 156 | 142 | 111 | 101 | 58 | 17 | 80 | 51 | ||
| 2014 | 19 | 16 | 8 | 20 | 8 | 18 | 31 | 18 | 70 | |||
| 2015 | 13 | 31 | 32 | 31 | 9 | |||||||
| 2016 | 0 | 17 | 140 | 7 | 37 | 9 | 55 | 15 | 20 | 16 | 17 | |
| 2017 | 31 | 18 | 60 | 13 | 12 | 54 | 54 | 36 | 5 | 31 | ||
| 2018 | 49 | 83 | 15 | 144 | 47 | 22 | 21 | 0 | ||||
| 2019 | 31 | 66 | 64 | 20 | 40 | 7 | 7 | |||||
| 2021 | 31 | 32 | 2 | 33 | ||||||||
| 2023 | 6 | |||||||||||
| - = No Data Reported; -- = Not Applicable; NA = Not Available; W = Withheld to avoid disclosure of individual company data. |
| Release Date: 3/29/2024 |
| Next Release Date: 4/30/2024 |