|
Download Data (XLS File) |
|
||||||||
|
||||||||
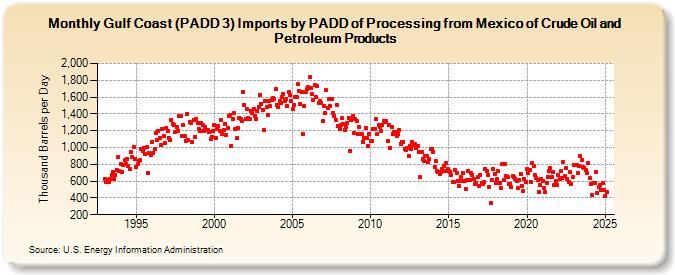
| Gulf Coast (PADD 3) Imports by PADD of Processing from Mexico of Crude Oil and Petroleum Products (Thousand Barrels per Day) | ||||||||
| Year | Jan | Feb | Mar | Apr | May | Jun | Jul | Aug | Sep | Oct | Nov | Dec |
|---|---|---|---|---|---|---|---|---|---|---|---|---|
| 1993 | 630 | 585 | 617 | 590 | 621 | 673 | 707 | 623 | 668 | 737 | 881 | 720 |
| 1994 | 801 | 711 | 788 | 850 | 800 | 866 | 781 | 742 | 941 | 886 | 1,011 | 864 |
| 1995 | 768 | 800 | 845 | 854 | 986 | 957 | 990 | 921 | 1,005 | 701 | 929 | 907 |
| 1996 | 1,070 | 938 | 981 | 1,177 | 1,091 | 1,198 | 1,111 | 1,025 | 1,221 | 1,135 | 1,055 | 1,234 |
| 1997 | 1,202 | 1,118 | 1,089 | 1,328 | 1,277 | 1,268 | 1,187 | 1,249 | 1,197 | 1,378 | 1,369 | 1,132 |
| 1998 | 1,272 | 1,141 | 1,078 | 1,401 | 1,084 | 1,306 | 1,291 | 1,065 | 1,331 | 1,128 | 1,344 | 1,296 |
| 1999 | 1,224 | 1,191 | 1,291 | 1,269 | 1,198 | 1,246 | 1,209 | 1,205 | 1,190 | 1,106 | 1,129 | 1,199 |
| 2000 | 1,268 | 1,109 | 1,219 | 1,258 | 1,196 | 1,325 | 1,161 | 1,213 | 1,280 | 1,144 | 1,227 | 1,370 |
| 2001 | 1,390 | 1,022 | 1,337 | 1,409 | 1,223 | 1,116 | 1,230 | 1,357 | 1,337 | 1,321 | 1,660 | 1,510 |
| 2002 | 1,342 | 1,455 | 1,349 | 1,336 | 1,439 | 1,407 | 1,460 | 1,375 | 1,337 | 1,432 | 1,482 | 1,630 |
| 2003 | 1,520 | 1,452 | 1,210 | 1,559 | 1,487 | 1,383 | 1,554 | 1,488 | 1,563 | 1,595 | 1,578 | 1,694 |
| 2004 | 1,509 | 1,483 | 1,557 | 1,533 | 1,599 | 1,637 | 1,554 | 1,574 | 1,493 | 1,661 | 1,630 | 1,557 |
| 2005 | 1,453 | 1,505 | 1,602 | 1,603 | 1,757 | 1,676 | 1,516 | 1,655 | 1,162 | 1,492 | 1,656 | 1,692 |
| 2006 | 1,725 | 1,834 | 1,706 | 1,631 | 1,562 | 1,740 | 1,604 | 1,727 | 1,525 | 1,555 | 1,531 | 1,314 |
| 2007 | 1,495 | 1,408 | 1,680 | 1,466 | 1,578 | 1,491 | 1,583 | 1,414 | 1,375 | 1,332 | 1,511 | 1,253 |
| 2008 | 1,222 | 1,263 | 1,348 | 1,276 | 1,213 | 1,241 | 1,292 | 1,352 | 959 | 1,324 | 1,370 | 1,177 |
| 2009 | 1,336 | 1,321 | 1,162 | 1,246 | 1,157 | 1,159 | 1,065 | 1,109 | 1,228 | 1,114 | 1,015 | 1,164 |
| 2010 | 1,077 | 1,082 | 1,219 | 1,223 | 1,339 | 1,156 | 1,268 | 1,244 | 1,200 | 1,267 | 1,315 | 1,303 |
| 2011 | 1,316 | 1,072 | 1,266 | 998 | 1,247 | 1,162 | 1,181 | 1,185 | 1,141 | 1,155 | 1,211 | 1,045 |
| 2012 | 1,071 | 1,060 | 987 | 973 | 997 | 904 | 1,015 | 983 | 1,070 | 1,031 | 1,039 | 994 |
| 2013 | 1,021 | 943 | 646 | 946 | 861 | 841 | 902 | 901 | 826 | 858 | 981 | 985 |
| 2014 | 947 | 767 | 834 | 723 | 710 | 684 | 703 | 742 | 785 | 723 | 815 | 740 |
| 2015 | 716 | 714 | 677 | 592 | 585 | 738 | 693 | 606 | 540 | 643 | 607 | 697 |
| 2016 | 602 | 509 | 612 | 722 | 613 | 696 | 676 | 631 | 566 | 577 | 649 | 542 |
| 2017 | 675 | 580 | 571 | 587 | 739 | 720 | 667 | 528 | 345 | 616 | 741 | 688 |
| 2018 | 575 | 625 | 715 | 578 | 516 | 798 | 614 | 805 | 655 | 646 | 569 | 570 |
| 2019 | 529 | 657 | 644 | 629 | 597 | 515 | 614 | 690 | 543 | 488 | 622 | 595 |
| 2020 | 742 | 700 | 729 | 585 | 814 | 783 | 673 | 641 | 612 | 467 | 557 | 627 |
| 2021 | 600 | 522 | 472 | 580 | 648 | 720 | 755 | 650 | 714 | 555 | 596 | 552 |
| 2022 | 668 | 624 | 717 | 636 | 829 | 657 | 754 | 627 | 588 | 710 | 564 | 649 |
| 2023 | 796 | 786 | 792 | 699 | 782 | 903 | 849 | 769 | 761 | 728 | 701 | 813 |
| 2024 | 632 | |||||||||||
| - = No Data Reported; -- = Not Applicable; NA = Not Available; W = Withheld to avoid disclosure of individual company data. |
| Release Date: 3/29/2024 |
| Next Release Date: 4/30/2024 |