|
Download Data (XLS File) |
|
||||||||
|
||||||||
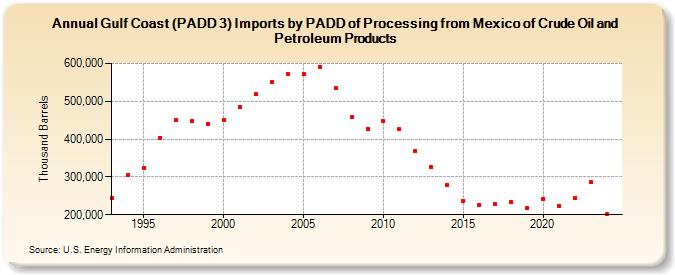
| Gulf Coast (PADD 3) Imports by PADD of Processing from Mexico of Crude Oil and Petroleum Products (Thousand Barrels) | ||||||||
| Decade | Year-0 | Year-1 | Year-2 | Year-3 | Year-4 | Year-5 | Year-6 | Year-7 | Year-8 | Year-9 |
|---|---|---|---|---|---|---|---|---|---|---|
| 1990's | 245,056 | 305,452 | 324,407 | 403,836 | 450,125 | 448,011 | 439,757 | |||
| 2000's | 450,556 | 484,662 | 518,446 | 550,171 | 573,110 | 571,212 | 591,124 | 535,081 | 458,746 | 427,717 |
| 2010's | 447,292 | 425,644 | 369,734 | 325,588 | 279,055 | 237,398 | 225,635 | 227,027 | 233,142 | 216,495 |
| 2020's | 241,975 | 224,064 | 244,377 | 285,347 |
| - = No Data Reported; -- = Not Applicable; NA = Not Available; W = Withheld to avoid disclosure of individual company data. |
| Release Date: 8/30/2024 |
| Next Release Date: 8/29/2025 |